Re: ATTN: Clodaldo was Performance problem. Could it be related to 8.3-beta4?
| От | Tom Lane |
|---|---|
| Тема | Re: ATTN: Clodaldo was Performance problem. Could it be related to 8.3-beta4? |
| Дата | |
| Msg-id | 2669.1200799980@sss.pgh.pa.us обсуждение исходный текст |
| Ответ на | Re: ATTN: Clodaldo was Performance problem. Could it be related to 8.3-beta4? (Clodoaldo <clodoaldo.pinto.neto@gmail.com>) |
| Ответы |
Re: ATTN: Clodaldo was Performance problem. Could it be
related to 8.3-beta4?
(Russell Smith <mr-russ@pws.com.au>)
Re: ATTN: Clodaldo was Performance problem. Could it be related to 8.3-beta4? (Martijn van Oosterhout <kleptog@svana.org>) Re: ATTN: Clodaldo was Performance problem. Could it be related to 8.3-beta4? (Clodoaldo <clodoaldo.pinto.neto@gmail.com>) Re: ATTN: Clodaldo was Performance problem. Could it be related to 8.3-beta4? (Alvaro Herrera <alvherre@commandprompt.com>) Re: ATTN: Clodaldo was Performance problem. Could it be related to 8.3-beta4? (Bruce Momjian <bruce@momjian.us>) |
| Список | pgsql-general |
Clodoaldo <clodoaldo.pinto.neto@gmail.com> writes:
> 2008/1/16, Tom Lane <tgl@sss.pgh.pa.us>:
>> I don't know of any reason to think that insertion is slower in 8.3
>> than it was in 8.2, and no one else has reported anything of the sort.
> The old server reproduces the behavior of the new one.
Okay, Clodoaldo kindly gave me access to his old server, and after
nearly a full day of poking at it I think I've figured out what is going
on. Recall that the problem query is
insert into usuarios (
data,
usuario,
pontos,
wus
)
select
(select data_serial from data_serial) as data,
ui.usuario_serial as usuario,
sum(pontos) as pontos,
sum(wus) as wus
from usuarios_temp as ut inner join usuarios_indice as ui
on ut.usuario = ui.usuario_nome and ut.n_time = ui.n_time
group by data, ui.usuario_serial
;
for which both 8.2 and 8.3 select a plan along the lines of
Subquery Scan "*SELECT*" (cost=318139.26..342283.02 rows=877955 width=20)
-> HashAggregate (cost=318139.26..331308.58 rows=877955 width=12)
InitPlan
-> Seq Scan on data_serial (cost=0.00..1.01 rows=1 width=4)
-> Merge Join (cost=101944.33..261142.53 rows=5699572 width=12)
Merge Cond: ((ut.n_time = ui.n_time) AND ((ut.usuario)::text = "inner"."?column4?"))
-> Index Scan using usuarios_temp_ndx on usuarios_temp ut (cost=0.00..55038.92 rows=883729 width=26)
-> Sort (cost=101944.33..104139.22 rows=877955 width=22)
Sort Key: ui.n_time, (ui.usuario_nome)::text
-> Seq Scan on usuarios_indice ui (cost=0.00..15273.55 rows=877955 width=22)
and the target table has non-unique indexes on "data" and "usuario"
(which are both simple integer columns, no surprises there).
I first tried running this query with "usuarios" initially empty, and
both 8.2 and 8.3 did fine. However, in the real scenario that Clodoaldo
is worried about, there's somewhere north of 135 million entries in
"usuarios" to begin with, and in that case 8.3 falls off a cliff while
8.2 doesn't --- the INSERT query takes about 400 seconds in 8.2 while
I gave up at 2h20m with 8.3. Why is that? Well, it turns out that 8.3
is thrashing a lot harder than 8.2 is. Each index on "usuarios" is
about 2.3GB (the same in both versions) and the server has only 2GB RAM,
so it's not real surprising that the working set might be more than RAM;
but why is 8.3 worse than 8.2?
You can see from the query that it's inserting the same constant "data"
value into every new row, and if I understand the context correctly this
value will be higher than all prior entries in the "usuarios" table. So
all the new entries in the "data" index are at the right-hand edge of
the index, and only a fairly small footprint is being touched at any
instant. strace'ing confirms that neither 8.2 nor 8.3 do much I/O at
all on that index. It's the index on the "usuario" column that is
thrashing.
The difference comes from the fact that the HashAggregate step --- which
is being done on hashing columns (data, usuario) --- is effectively
reading out in hash-value order for usuario, meaning that that is the
order in which we make index insertions. 8.2 had an extremely chintzy
hash function for integers --- basically just return the negative of the
integer value --- while 8.3 takes it seriously and produces a nicely
randomized hash value. This means that the usuario values are returned
in a relatively well ordered fashion in 8.2 and a nearly totally random
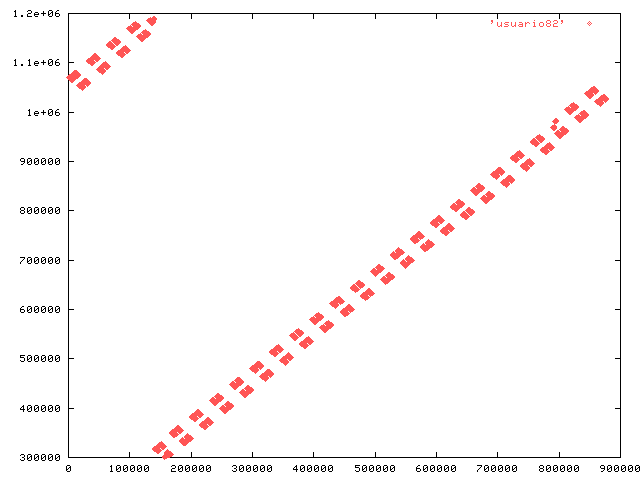
one in 8.3. I captured the output of the SELECT in both 8.2 and 8.3;
attached are plots showing the usuario values against row number. From
this we can see that 8.2 has a working set that is a relatively small
part of the index at any instant, whereas 8.3 has the entire index as
working set ... and it doesn't fit into RAM. Ergo, lots of disk seek
delays.
I don't think we want to back off the improved hashing functions in 8.3
--- in most scenarios they should lead to significantly better
performance. But in this particular context they hurt.
A possibly usable workaround for now is "set enable_hashagg = off"
to force a GroupAggregate plan, which will deliver the values sorted
by (data, usuario) rather than by their hash values. This helps both
versions, bringing the runtime down to something like 250 seconds,
because the index on usuario then has complete locality of access.
Alternatively, doubling the server's RAM would probably make the problem
go away (for awhile, until the index reaches 4GB).
In the long run, for queries inserting many rows it might be interesting
to accumulate all the entries intended for a btree index and sort them
before inserting. Not sure about possible downsides of that.
regards, tom lane
Вложения

В списке pgsql-general по дате отправления:
Следующее
От: Russell SmithДата:
Сообщение: Re: ATTN: Clodaldo was Performance problem. Could it be related to 8.3-beta4?