Hi All,
We are trying to gain some insight into a performance bottleneck that we are hitting while load testing Postgres on 11.11. We are running in a GCP environment on a server with 244 vcpu's
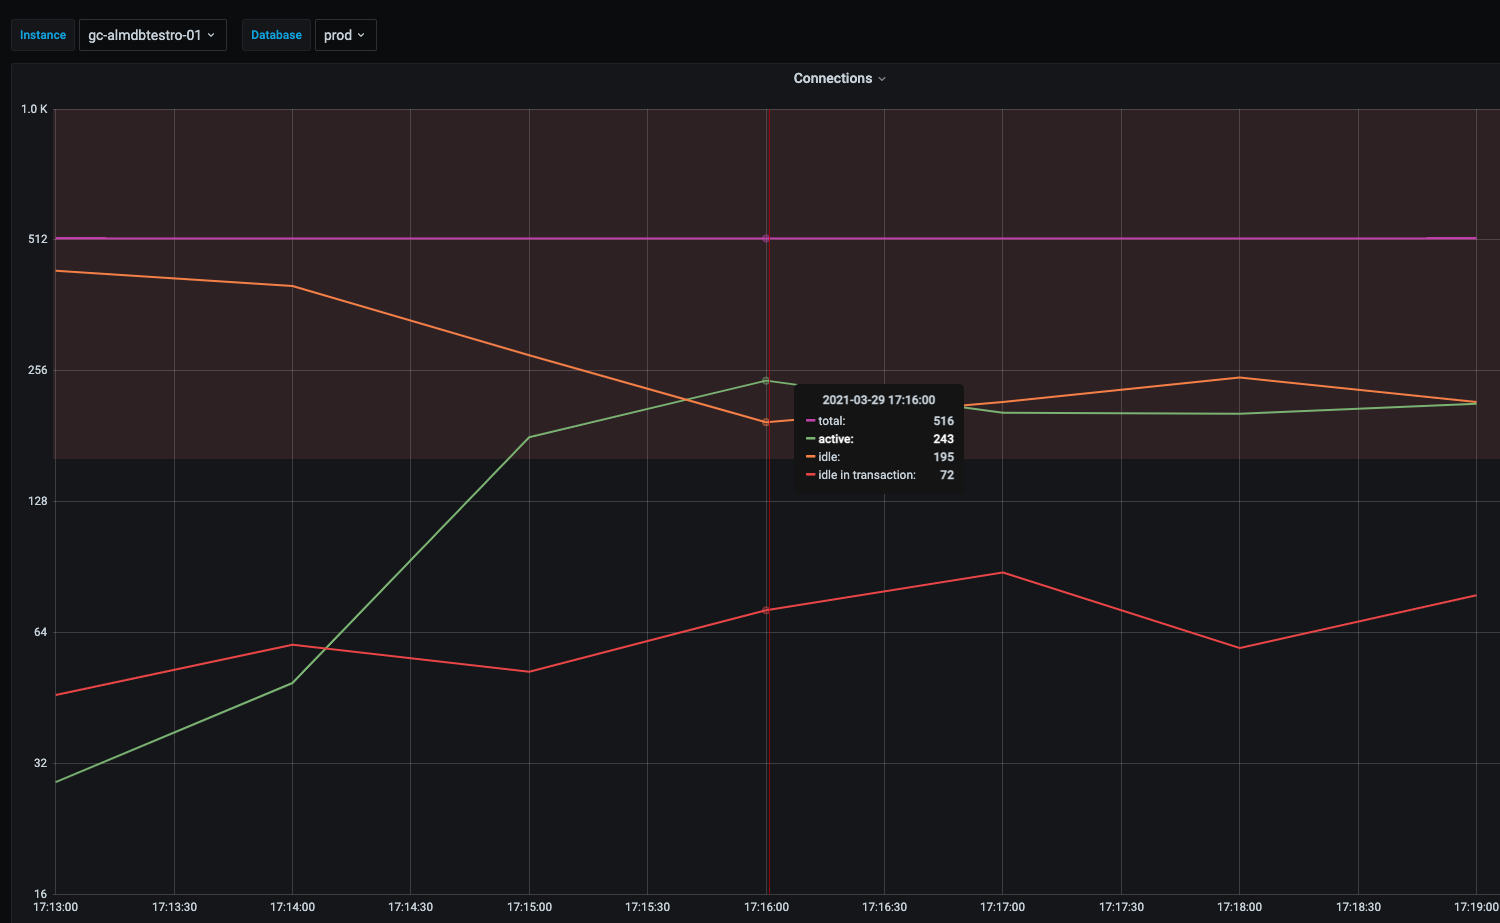
In our testing active sessions are running fine and then we hit a hockey stick where active sessions spike way up but we don’t see a corresponding increase in CPU utlization on the server.
Here’s a grafana graph of the pg_stat_activity sessions states.
CPU utilization is not close to maximum when this event occurs with the server CPU utilization being 2/3 idle. Here’s a quick look at dstat output when the bottleneck occurs:

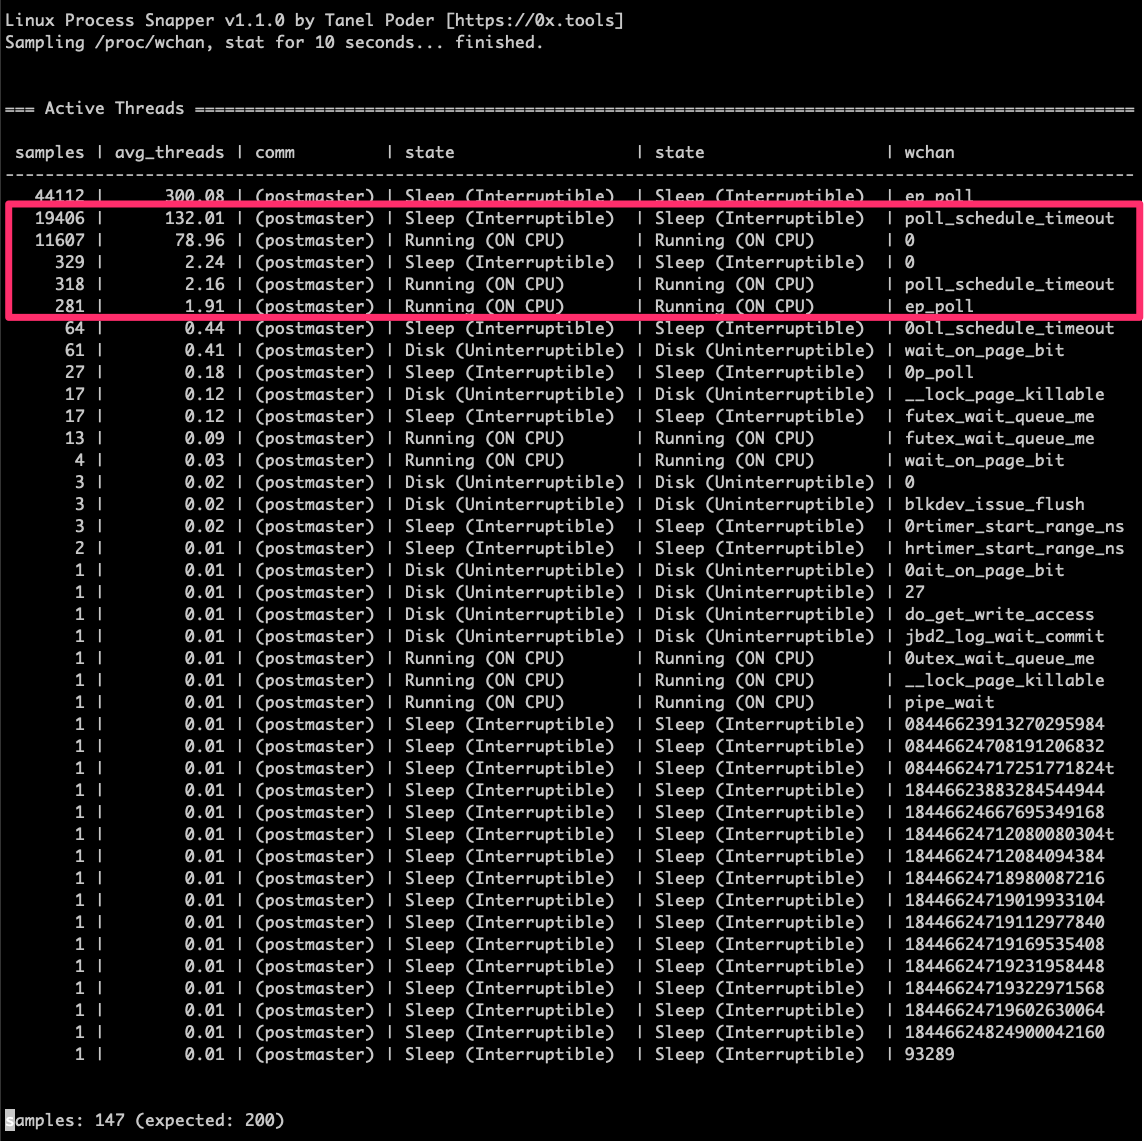
What has us stumped is that while we have a lot of sessions in an active state when we sample the postmaster threads with a Linux process profiling tool we see that many of the postmaster process threads are in a sleep state on the wait channel “poll schedule timeout” and only a fraction of what the database considers to be active sessions are actually running on the CPU. Here’s what we see in the profiler.
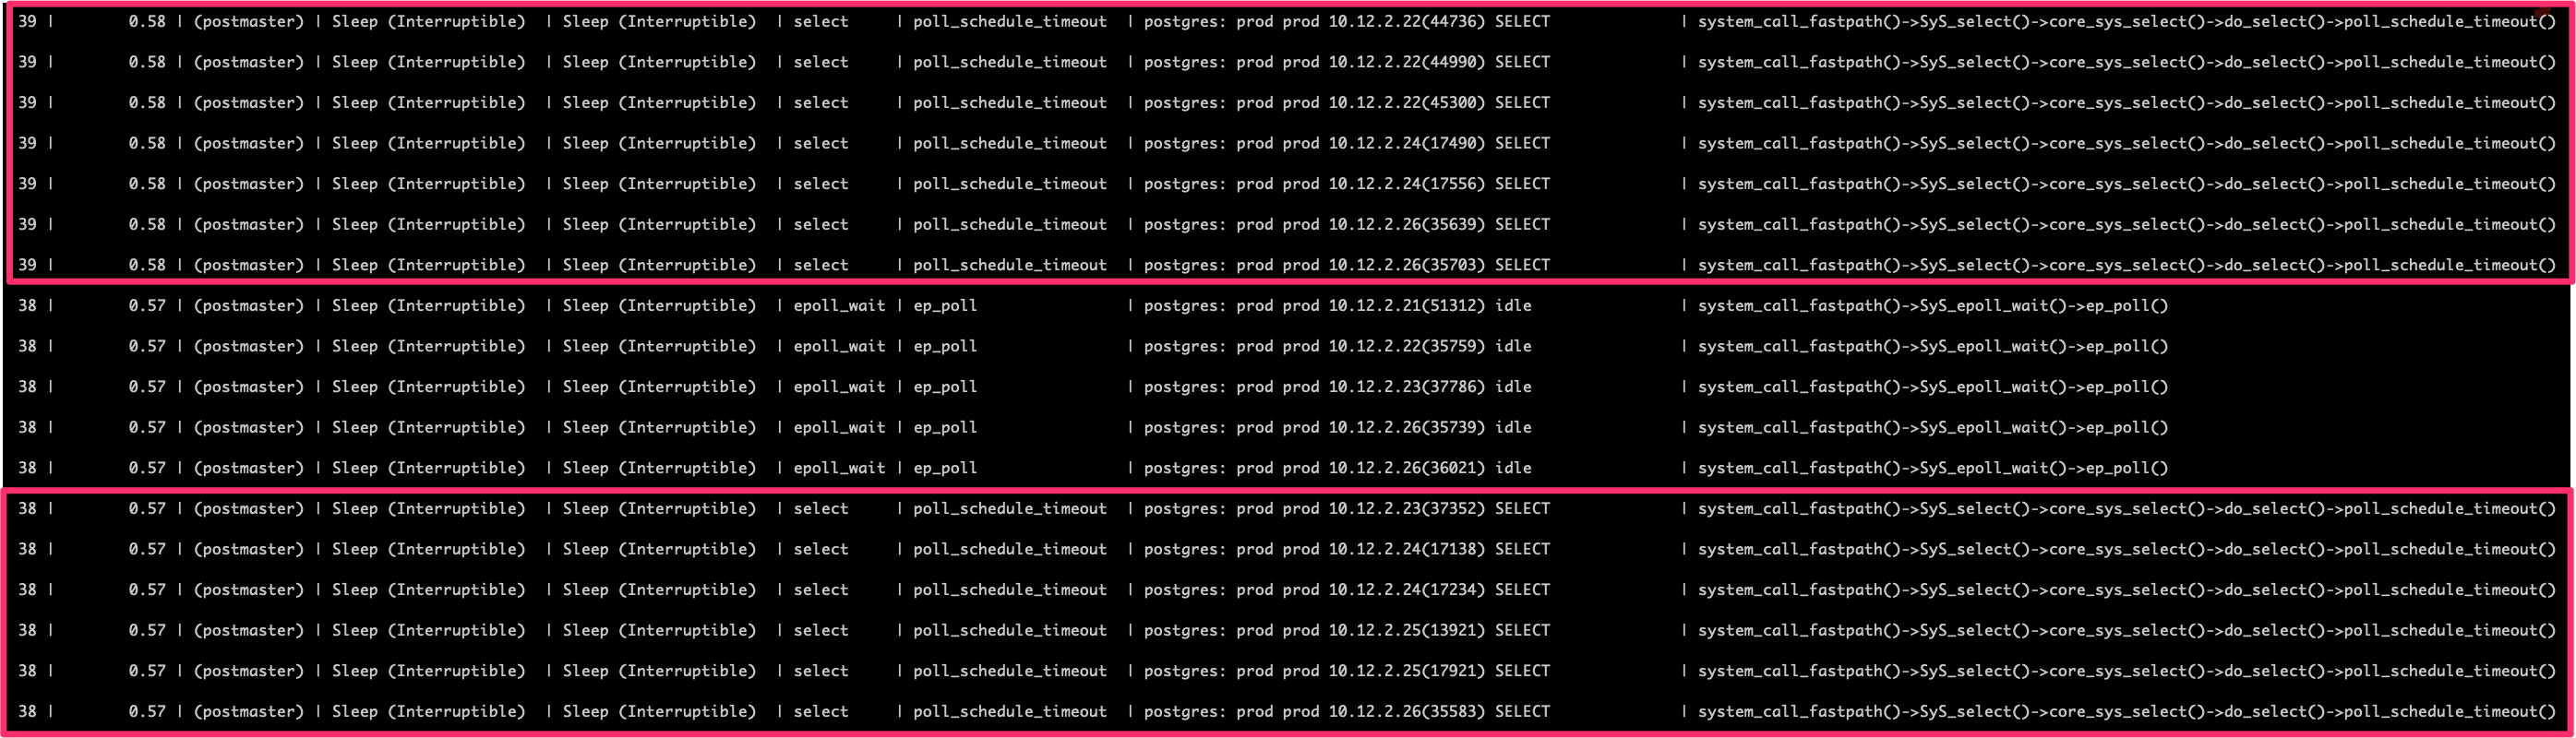
If we drill down into the postmaster threads that are sleeping we can verify that these threads are truly in a postgres select statement and waiting on a kernel stack backtrace of "system_call_fastpath()->SyS_select()->core_sys_select()->do_select()->poll_schedule_timeout()"
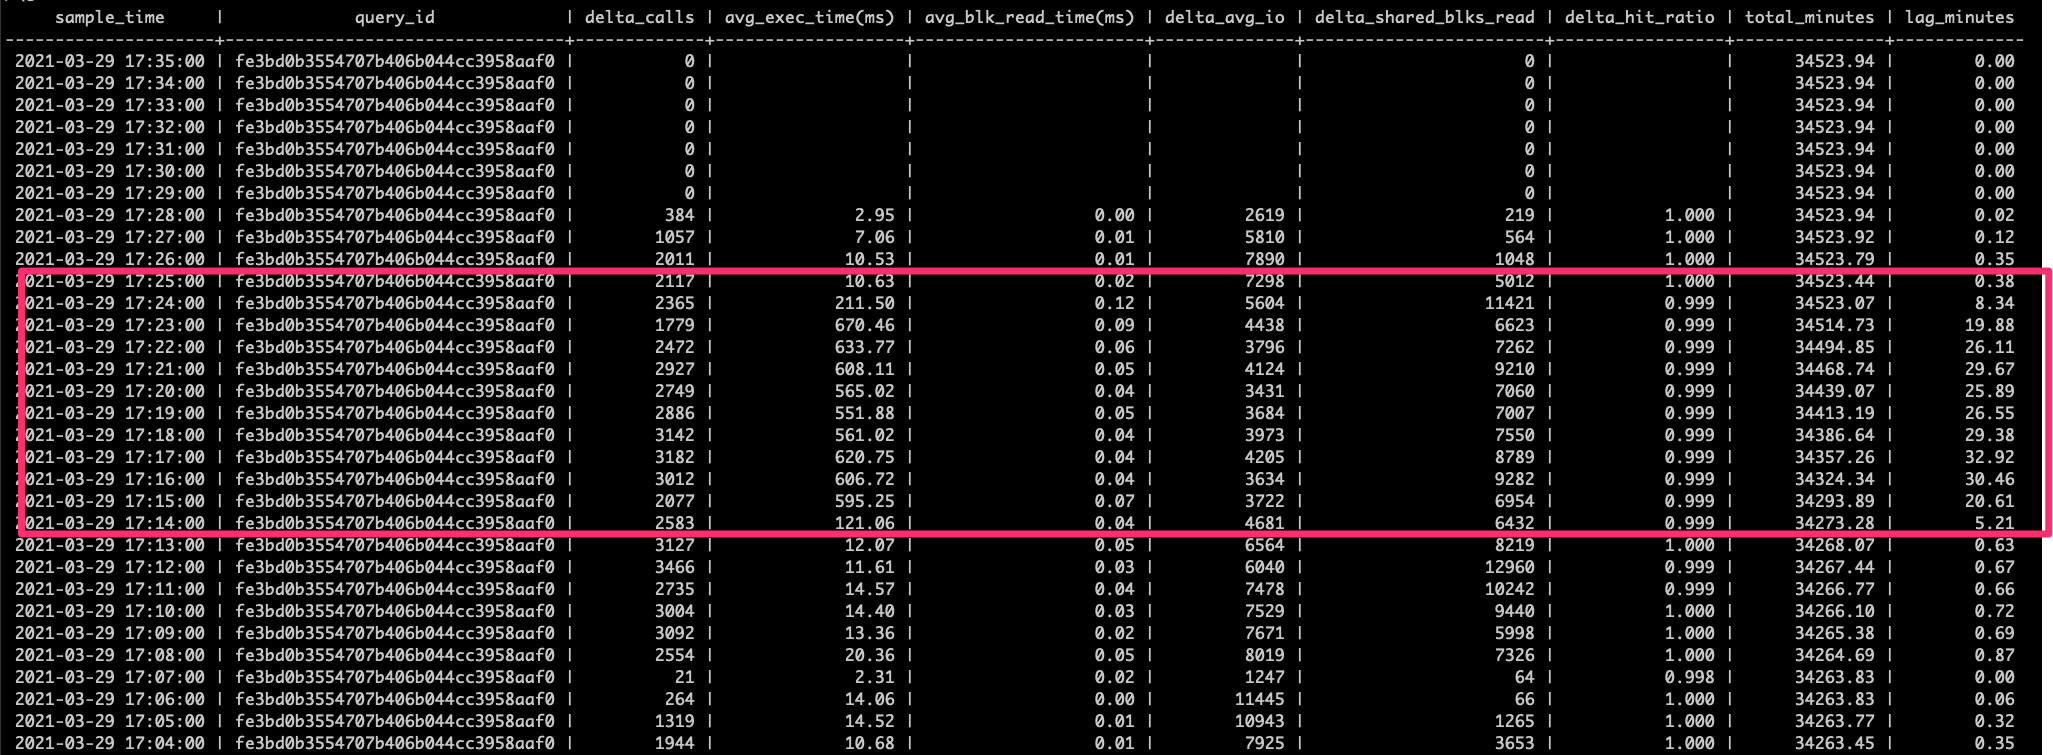
Finally, when the bottleneck occurs queries that normally run in low double digit milliseconds degrade into triple digit milliseconds worth of execution time. Here’s an example query showing the average execution time degradation. The query is a simple two table join with the leading table being accessed by primary key.
All of this feels like the postmaster threads that are in an active state but sleeping at the kernel level are in a sleep/retry cycle waiting on a resource. The challenge is that we have no idea what resource postgres is waiting on because we see no wait events in pg_stat_activity for these active sessions.
Any ideas on what we could look at to understand this behavior would be appreciated.
Regards,
Craig Jackson