Обсуждение: Fwd: Help!Why CPU Usage and LoadAverage Jump up Suddenly
Hi, all
We find so weird problem on our productive PostgreSQL system. And I don't know how could I do to resolve this problem.
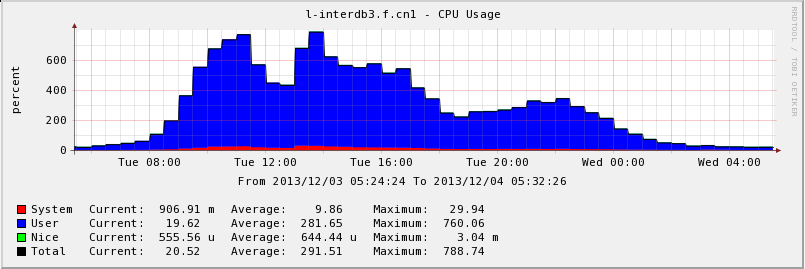
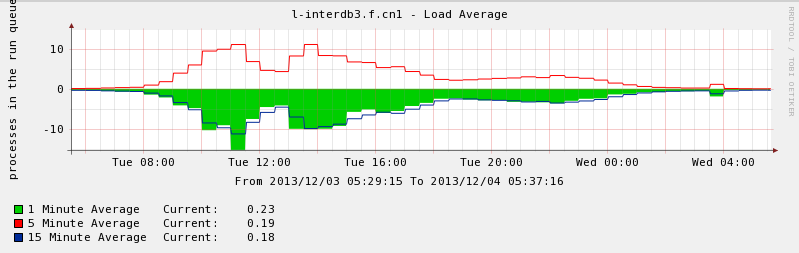
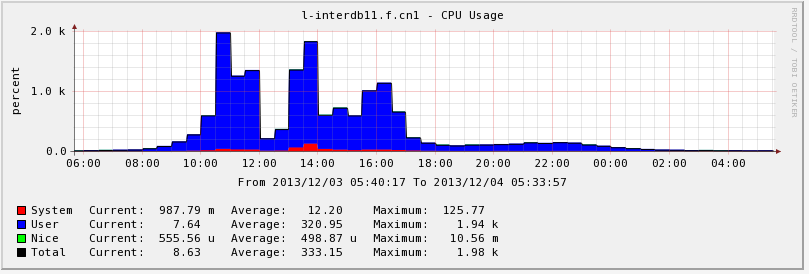
We deployed PostgreSQL 9.2.4 on two system environments, and the performances between them are absolutely different. one of them it's perfect, and the other one lets me down, CPU Usage and LoadAverage Jumped up Suddenly when concurrency smoothly rising up, simultaneously, average response time become unacceptable.
We find so weird problem on our productive PostgreSQL system. And I don't know how could I do to resolve this problem.
We deployed PostgreSQL 9.2.4 on two system environments, and the performances between them are absolutely different. one of them it's perfect, and the other one lets me down, CPU Usage and LoadAverage Jumped up Suddenly when concurrency smoothly rising up, simultaneously, average response time become unacceptable.
Anyone, who could give me some advice?
The parameters of system environment and PotgreSQL listed below:
The parameters of system environment and PotgreSQL listed below:
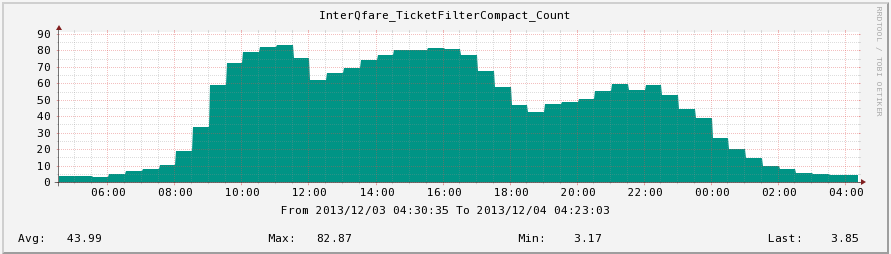
- QPS Chart

- performance perfect on
- system environment
$ uname -a
Linux l-interdb3.f.cn1 2.6.18-238.19.1.el5 #1 SMP Fri Jul 15 07:31:24 EDT 2011 x86_64 x86_64 x86_64 GNU/Linux

$ cat /etc/redhat-release
CentOS release 5.6 (Final)

$ free -m             total       used       free     shared    buffers     cached
Mem:         96678      95620       1058          0        443      84607
-/+ buffers/cache:      10568      86109
Swap:        49151          0      49151

$ cat /proc/cpuinfo
processor       : 23
vendor_id       : GenuineIntel
cpu family      : 6
model           : 44
model name      : Intel(R) Xeon(R) CPU           E5645  @ 2.40GHz
stepping        : 2
cpu MHz         : 2400.146
cache size      : 12288 KB
physical id     : 1
siblings        : 12
core id         : 9
cpu cores       : 6
apicid          : 51
fpu             : yes
fpu_exception   : yes
cpuid level     : 11
wp              : yes
flags           : fpu vme de pse tsc msr pae mce cx8 apic sep mtrr pge mca cmov pat pse36 clflush dts acpi mmx fxsr sse sse2 ss ht tm syscall nx pdpe1gb rdtscp lm constant_tsc ida nonstop_tsc arat pni monitor ds_cpl vmx smx est tm2 ssse3 cx16 xtpr sse4_1 sse4_2 popcnt lahf_lm
bogomips        : 4800.10
clflush size    : 64
cache_alignment : 64
address sizes   : 40 bits physical, 48 bits virtual
power management: [8]
- pg_config
BINDIR = /opt/pg92/bin
DOCDIR = /opt/pg92/share/doc/postgresql
HTMLDIR = /opt/pg92/share/doc/postgresql
INCLUDEDIR = /opt/pg92/include
PKGINCLUDEDIR = /opt/pg92/include/postgresql
INCLUDEDIR-SERVER = /opt/pg92/include/postgresql/server
LIBDIR = /opt/pg92/lib
PKGLIBDIR = /opt/pg92/lib/postgresql
LOCALEDIR = /opt/pg92/share/locale
MANDIR = /opt/pg92/share/man
SHAREDIR = /opt/pg92/share/postgresql
SYSCONFDIR = /opt/pg92/etc/postgresql
PGXS = /opt/pg92/lib/postgresql/pgxs/src/makefiles/pgxs.mk
CONFIGURE = '--prefix=/opt/pg92' '--with-perl' '--with-libxml' '--with-libxslt' '--with-ossp-uuid' 'CFLAGS= -march=core2 -O2 '
CC = gcc
CPPFLAGS = -D_GNU_SOURCE -I/usr/include/libxml2
CFLAGS = -march=core2 -O2  -Wall -Wmissing-prototypes -Wpointer-arith -Wdeclaration-after-statement -Wendif-labels -Wmissing-format-attribute -Wformat-security -fno-strict-aliasing -fwrapv
CFLAGS_SL = -fpic
LDFLAGS = -Wl,-rpath,'/opt/pg92/lib',--enable-new-dtags
LDFLAGS_EX =
LDFLAGS_SL =
LIBS = -lpgport -lxslt -lxml2 -lz -lreadline -ltermcap -lcrypt -ldl -lm
VERSION = PostgreSQL 9.2.4
- performace
- system environment


- performance weird
- system environment(kernel 2.6.32-220 is also tested, no different on performance)
$ uname -a
Linux l-interdb11.f.cn1 3.2.34-1.el6.x86_64 #1 SMP Mon Jan 14 18:23:19 CST 2013 x86_64 x86_64 x86_64 GNU/Linux

$ cat /etc/redhat-release
CentOS release 6.2 (Final)

$ free -m             total       used       free     shared    buffers     cached
Mem:         64387      62907       1479          0        182      56524
-/+ buffers/cache:       6200      58186
Swap:        49151        494      48657

$ cat /proc/cpuinfo
processor	: 23
vendor_id	: GenuineIntel
cpu family	: 6
model		: 45
model name	: Intel(R) Xeon(R) CPU E5-2630 0 @ 2.30GHz
stepping	: 7
microcode	: 0x70d
cpu MHz		: 2300.020
cache size	: 15360 KB
physical id	: 1
siblings	: 12
core id		: 5
cpu cores	: 6
apicid		: 43
initial apicid	: 43
fpu		: yes
fpu_exception	: yes
cpuid level	: 13
wp		: yes
flags		: fpu vme de pse tsc msr pae mce cx8 apic sep mtrr pge mca cmov pat pse36 clflush dts acpi mmx fxsr sse sse2 ss ht tm pbe syscall nx pdpe1gb rdtscp lm constant_tsc arch_perfmon pebs bts rep_good nopl xtopology nonstop_tsc aperfmperf pni pclmulqdq dtes64 monitor ds_cpl vmx smx est tm2 ssse3 cx16 xtpr pdcm pcid dca sse4_1 sse4_2 x2apic popcnt tsc_deadline_timer aes xsave avx lahf_lm ida arat xsaveopt pln pts dtherm tpr_shadow vnmi flexpriority ept vpid
bogomips	: 4599.34
clflush size	: 64
cache_alignment	: 64
address sizes	: 46 bits physical, 48 bits virtual
- pg_config
$ pg_config
BINDIR = /opt/pg92/bin
DOCDIR = /opt/pg92/share/doc/postgresql
HTMLDIR = /opt/pg92/share/doc/postgresql
INCLUDEDIR = /opt/pg92/include
PKGINCLUDEDIR = /opt/pg92/include/postgresql
INCLUDEDIR-SERVER = /opt/pg92/include/postgresql/server
LIBDIR = /opt/pg92/lib
PKGLIBDIR = /opt/pg92/lib/postgresql
LOCALEDIR = /opt/pg92/share/locale
MANDIR = /opt/pg92/share/man
SHAREDIR = /opt/pg92/share/postgresql
SYSCONFDIR = /opt/pg92/etc/postgresql
PGXS = /opt/pg92/lib/postgresql/pgxs/src/makefiles/pgxs.mk
CONFIGURE = '--prefix=/opt/pg92' '--with-perl' '--with-libxml' '--with-libxslt' '--with-ossp-uuid' 'CFLAGS= -m64 -march=native -O3 -mavx'
CC = gcc
CPPFLAGS = -D_GNU_SOURCE -I/usr/include/libxml2
CFLAGS = -m64 -march=native -O3 -mavx -Wall -Wmissing-prototypes -Wpointer-arith -Wdeclaration-after-statement -Wendif-labels -Wmissing-format-attribute -Wformat-security -fno-strict-aliasing -fwrapv -fexcess-precision=standard
CFLAGS_SL = -fpic
LDFLAGS = -Wl,--as-needed -Wl,-rpath,'/opt/pg92/lib',--enable-new-dtags
LDFLAGS_EX =
LDFLAGS_SL =
LIBS = -lpgport -lxslt -lxml2 -lz -lreadline -lcrypt -ldl -lm
VERSION = PostgreSQL 9.2.4
- performace

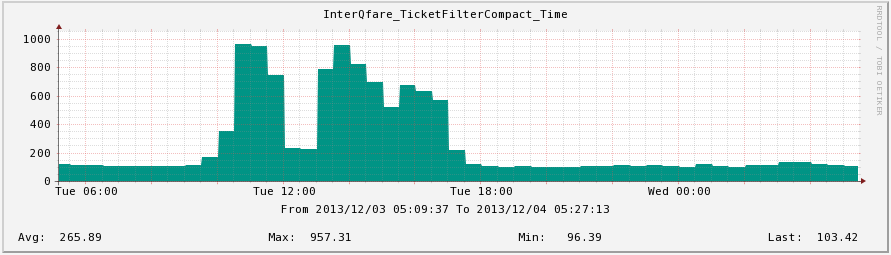
- Average Response Time:
- system environment(kernel 2.6.32-220 is also tested, no different on performance)
Вложения
one more word.
high light somthting
performance weird :
...
pg_config:
high light somthting
performance weird :
...
pg_config:
CFLAGS = -m64 -march=native -O3 -mavx -Wall -Wmissing-prototypes -Wpointer-arith -Wdeclaration-after-statement -Wendif-labels -Wmissing-format-attribute -Wformat-security -fno-strict-aliasing ...2013/12/5 吕晓旭 <lxxstcno1@gmail.com>
Hi, all
We find so weird problem on our productive PostgreSQL system. And I don't know how could I do to resolve this problem.
We deployed PostgreSQL 9.2.4 on two system environments, and the performances between them are absolutely different. one of them it's perfect, and the other one lets me down, CPU Usage and LoadAverage Jumped up Suddenly when concurrency smoothly rising up, simultaneously, average response time become unacceptable.Anyone, who could give me some advice?
The parameters of system environment and PotgreSQL listed below:
- QPS Chart
- performance perfect on
- system environment
$ uname -a Linux l-interdb3.f.cn1 2.6.18-238.19.1.el5 #1 SMP Fri Jul 15 07:31:24 EDT 2011 x86_64 x86_64 x86_64 GNU/Linux $ cat /etc/redhat-release CentOS release 5.6 (Final) $ free -m total used free shared buffers cached Mem: 96678 95620 1058 0 443 84607 -/+ buffers/cache: 10568 86109 Swap: 49151 0 49151 $ cat /proc/cpuinfo processor : 23 vendor_id : GenuineIntel cpu family : 6 model : 44 model name : Intel(R) Xeon(R) CPU E5645 @ 2.40GHz stepping : 2 cpu MHz : 2400.146 cache size : 12288 KB physical id : 1 siblings : 12 core id : 9 cpu cores : 6 apicid : 51 fpu : yes fpu_exception : yes cpuid level : 11 wp : yes flags : fpu vme de pse tsc msr pae mce cx8 apic sep mtrr pge mca cmov pat pse36 clflush dts acpi mmx fxsr sse sse2 ss ht tm syscall nx pdpe1gb rdtscp lm constant_tsc ida nonstop_tsc arat pni monitor ds_cpl vmx smx est tm2 ssse3 cx16 xtpr sse4_1 sse4_2 popcnt lahf_lm bogomips : 4800.10 clflush size : 64 cache_alignment : 64 address sizes : 40 bits physical, 48 bits virtual power management: [8]- pg_config
BINDIR = /opt/pg92/bin DOCDIR = /opt/pg92/share/doc/postgresql HTMLDIR = /opt/pg92/share/doc/postgresql INCLUDEDIR = /opt/pg92/include PKGINCLUDEDIR = /opt/pg92/include/postgresql INCLUDEDIR-SERVER = /opt/pg92/include/postgresql/server LIBDIR = /opt/pg92/lib PKGLIBDIR = /opt/pg92/lib/postgresql LOCALEDIR = /opt/pg92/share/locale MANDIR = /opt/pg92/share/man SHAREDIR = /opt/pg92/share/postgresql SYSCONFDIR = /opt/pg92/etc/postgresql PGXS = /opt/pg92/lib/postgresql/pgxs/src/makefiles/pgxs.mk CONFIGURE = '--prefix=/opt/pg92' '--with-perl' '--with-libxml' '--with-libxslt' '--with-ossp-uuid' 'CFLAGS= -march=core2 -O2 ' CC = gcc CPPFLAGS = -D_GNU_SOURCE -I/usr/include/libxml2 CFLAGS = -march=core2 -O2 -Wall -Wmissing-prototypes -Wpointer-arith -Wdeclaration-after-statement -Wendif-labels -Wmissing-format-attribute -Wformat-security -fno-strict-aliasing -fwrapv CFLAGS_SL = -fpic LDFLAGS = -Wl,-rpath,'/opt/pg92/lib',--enable-new-dtags LDFLAGS_EX = LDFLAGS_SL = LIBS = -lpgport -lxslt -lxml2 -lz -lreadline -ltermcap -lcrypt -ldl -lm VERSION = PostgreSQL 9.2.4- performace
- performance weird
- system environment(kernel 2.6.32-220 is also tested, no different on performance)
$ uname -a Linux l-interdb11.f.cn1 3.2.34-1.el6.x86_64 #1 SMP Mon Jan 14 18:23:19 CST 2013 x86_64 x86_64 x86_64 GNU/Linux $ cat /etc/redhat-release CentOS release 6.2 (Final) $ free -m total used free shared buffers cached Mem: 64387 62907 1479 0 182 56524 -/+ buffers/cache: 6200 58186 Swap: 49151 494 48657 $ cat /proc/cpuinfo processor : 23 vendor_id : GenuineIntel cpu family : 6 model : 45 model name : Intel(R) Xeon(R) CPU E5-2630 0 @ 2.30GHz stepping : 7 microcode : 0x70d cpu MHz : 2300.020 cache size : 15360 KB physical id : 1 siblings : 12 core id : 5 cpu cores : 6 apicid : 43 initial apicid : 43 fpu : yes fpu_exception : yes cpuid level : 13 wp : yes flags : fpu vme de pse tsc msr pae mce cx8 apic sep mtrr pge mca cmov pat pse36 clflush dts acpi mmx fxsr sse sse2 ss ht tm pbe syscall nx pdpe1gb rdtscp lm constant_tsc arch_perfmon pebs bts rep_good nopl xtopology nonstop_tsc aperfmperf pni pclmulqdq dtes64 monitor ds_cpl vmx smx est tm2 ssse3 cx16 xtpr pdcm pcid dca sse4_1 sse4_2 x2apic popcnt tsc_deadline_timer aes xsave avx lahf_lm ida arat xsaveopt pln pts dtherm tpr_shadow vnmi flexpriority ept vpid bogomips : 4599.34 clflush size : 64 cache_alignment : 64 address sizes : 46 bits physical, 48 bits virtual- pg_config
$ pg_config BINDIR = /opt/pg92/bin DOCDIR = /opt/pg92/share/doc/postgresql HTMLDIR = /opt/pg92/share/doc/postgresql INCLUDEDIR = /opt/pg92/include PKGINCLUDEDIR = /opt/pg92/include/postgresql INCLUDEDIR-SERVER = /opt/pg92/include/postgresql/server LIBDIR = /opt/pg92/lib PKGLIBDIR = /opt/pg92/lib/postgresql LOCALEDIR = /opt/pg92/share/locale MANDIR = /opt/pg92/share/man SHAREDIR = /opt/pg92/share/postgresql SYSCONFDIR = /opt/pg92/etc/postgresql PGXS = /opt/pg92/lib/postgresql/pgxs/src/makefiles/pgxs.mk CONFIGURE = '--prefix=/opt/pg92' '--with-perl' '--with-libxml' '--with-libxslt' '--with-ossp-uuid' 'CFLAGS= -m64 -march=native -O3 -mavx' CC = gcc CPPFLAGS = -D_GNU_SOURCE -I/usr/include/libxml2 CFLAGS = -m64 -march=native -O3 -mavx -Wall -Wmissing-prototypes -Wpointer-arith -Wdeclaration-after-statement -Wendif-labels -Wmissing-format-attribute -Wformat-security -fno-strict-aliasing -fwrapv -fexcess-precision=standard CFLAGS_SL = -fpic LDFLAGS = -Wl,--as-needed -Wl,-rpath,'/opt/pg92/lib',--enable-new-dtags LDFLAGS_EX = LDFLAGS_SL = LIBS = -lpgport -lxslt -lxml2 -lz -lreadline -lcrypt -ldl -lm VERSION = PostgreSQL 9.2.4- performace

- Average Response Time:

Вложения
On Thu, Dec 5, 2013 at 1:46 AM, 吕晓旭 <lxxstcno1@gmail.com> wrote:
>
>
>
> Hi, all
>     We find so weird problem on our productive PostgreSQL system. And I don't know how could I do to resolve this
problem.
>     We deployed PostgreSQL 9.2.4 on two system environments,  and the performances between them are absolutely
different.one of them it's perfect, and the other one lets me down, CPU Usage and LoadAverage Jumped up Suddenly when
concurrencysmoothly rising up, simultaneously, average response time become unacceptable.
>     Anyone, who could give me some advice?
>
>     The parameters of system environment and PotgreSQL listed below:

Have you tried  monitoring your IO subsystem when this happens? I'd be
interested in iostat, vmstat, iotop, and so on to see what the IO
looks like.
Is khugepaged running during the stalls?
http://www.postgresql.org/message-id/20130716195834.8fe5c79249cb2ff0d4270b3e@yahoo.es

Matt

On Thu, Dec 5, 2013 at 7:44 AM, Scott Marlowe <scott.marlowe@gmail.com> wrote:
> On Thu, Dec 5, 2013 at 1:46 AM, 吕晓旭 <lxxstcno1@gmail.com> wrote:
>>
>>
>>
>> Hi, all
>>     We find so weird problem on our productive PostgreSQL system. And I don't know how could I do to resolve this
problem.
>>     We deployed PostgreSQL 9.2.4 on two system environments,  and the performances between them are absolutely
different.one of them it's perfect, and the other one lets me down, CPU Usage and LoadAverage Jumped up Suddenly when
concurrencysmoothly rising up, simultaneously, average response time become unacceptable.
>>     Anyone, who could give me some advice?
>>
>>     The parameters of system environment and PotgreSQL listed below:
>
> Have you tried  monitoring your IO subsystem when this happens? I'd be
> interested in iostat, vmstat, iotop, and so on to see what the IO
> looks like.
>
>
> --
> Sent via pgsql-general mailing list (pgsql-general@postgresql.org)
> To make changes to your subscription:
> http://www.postgresql.org/mailpref/pgsql-general
On 12/5/2013 12:46 AM, 吕晓旭 wrote:
>     We find so weird problem on our productive PostgreSQL system. And
> I don't know how could I do to resolve this problem.
>     We deployed PostgreSQL 9.2.4 on two system environments,  and the
> performances between them are absolutely different. one of them it's
> perfect, and the other one lets me down, CPU Usage and LoadAverage
> Jumped up Suddenly when concurrency smoothly rising up,
> simultaneously, average response time become unacceptable.

I'm curious why you built your own postgres instead of using the
yum.postgresql.com repository versions?

and I second the suggestion, IO performance is likely a major factor
here.     also, you don't give your postgresql.conf tuning settings,
file systems configurations, hardware storage configurations, etc.

--
john r pierce                                      37N 122W
somewhere on the middle of the left coast
there are several reason drive us to build ourselves rpm, the most important is we want to install it in a directory self definition
and another reason is setting CFLAGS(add -mavx for example, high light at previous ).
because, without this compile parameter, response time is suffering on dell machine
according to the system monitor chart shown on cacti, i don't think IO is heavy, no matter "cpu io wait" and "Reads/Writes - sda".
there is no monitor items showing strange behavior of IO system, and no different between low concurrency and heavy concurrency,
and no different between two environments.
I find something with top : CPU usage of each postgres process is not so high when low concurrency, the highest one is about 50%.
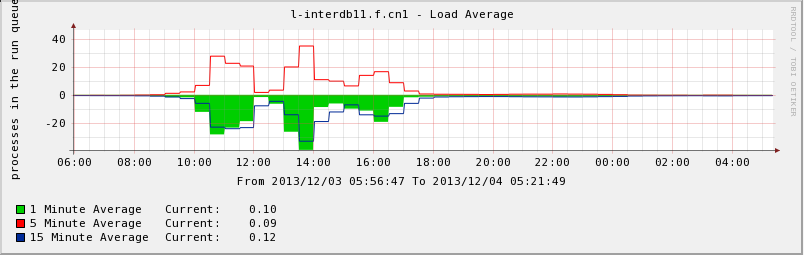
but when concurrency gradually increased, some postgres process cpu usage reach 100%, and keep a moment. and at these high concurrency period runq-sz(with sar -q) is very long, sometime 50 process waiting the CPU time.
so is there something like spin-lock keep the CPU time?
some configurations on the both system:
shared_buffers = 8192MB
work_mem =256MB
maintenance_work_mem = 160MB
full_page_writes = off
wal_buffers = 10MB
wal_keep_segments = 150
hardware configurations list below(both environment with raid 10):
* perfect one:
$ sudo hwconfig
Summary: HP DL360 G7, 1 x Xeon E5645 2.40GHz, 94.4GB / 96GB 1333MHz DDR3
System: HP ProLiant DL360 G7
Processors: 1 (of 2) x Xeon E5645 2.40GHz 133MHz FSB (HT enabled, 6 cores, 24 threads)
Memory: 94.4GB / 96GB 1333MHz DDR3 == 6 x 16GB, 12 x empty
Disk: cciss/c0d0 (cciss0): 1.2TB (48%) RAID-10 == 4 x HP-EG0600FBLSH
Disk-Control: cciss0: Hewlett-Packard Company Smart Array G6 controllers, FW 5.14, Cache on 256MB/768MB (R/W)
Chipset: Intel 82801JIB (ICH10)
Network: eth0 (bnx2): Broadcom NetXtreme II BCM5709 Gigabit, e4:11:5b:ed:12:1c, 1000Mb/s <full-duplex>
Network: eth1 (bnx2): Broadcom NetXtreme II BCM5709 Gigabit, e4:11:5b:ed:12:1e, no carrier
Network: eth2 (bnx2): Broadcom NetXtreme II BCM5709 Gigabit, e4:11:5b:ed:12:58, no carrier
Network: eth3 (bnx2): Broadcom NetXtreme II BCM5709 Gigabit, e4:11:5b:ed:12:5a, no carrier
OS: CentOS 5.6 (Final), Linux 2.6.18-238.19.1.el5 x86_64, 64-bit
BIOS: HP P68 12/02/2012
Hostname: l-interdb3.f.cn1
* the one performances so bad:
$ sudo hwconfig
hwconfig: warning: could not run MegaCli
Summary: Dell R620, 1 x Xeon E5-2630 0 2.30GHz, 62.9GB / 64GB 1600MHz DDR3
System: Dell PowerEdge R620 (Dell 0D2D5F)
Processors: 1 (of 2) x Xeon E5-2630 0 2.30GHz 7200MHz FSB (HT enabled, 6 cores, 24 threads)
Memory: 62.9GB / 64GB 1600MHz DDR3 == 8 x 8GB, 16 x empty
Disk: sda (scsi6): 1.2TB (29%) JBOD == 1 x DELL-PERC-H710P
Disk-Control: ahci0: Intel Patsburg 6-Port SATA AHCI Controller
Disk-Control: megaraid_sas0: LSI Logic / Symbios Logic MegaRAID SAS 2208 [Thunderbolt]
Network: em1 (tg3): Broadcom NetXtreme BCM5720 Gigabit PCIe, e0:db:55:1f:9b:d8, 1000Mb/s <full-duplex>
Network: em2 (tg3): Broadcom NetXtreme BCM5720 Gigabit PCIe, e0:db:55:1f:9b:d9, no carrier
Network: em3 (tg3): Broadcom NetXtreme BCM5720 Gigabit PCIe, e0:db:55:1f:9b:da, no carrier
Network: em4 (tg3): Broadcom NetXtreme BCM5720 Gigabit PCIe, e0:db:55:1f:9b:db, no carrier
OS: CentOS 6.2 (Final), Linux 3.2.34-1.el6.x86_64 x86_64, 64-bit
BIOS: Dell 1.4.8 10/25/2012
Hostname: l-interdb11.f.cn1
because, without this compile parameter, response time is suffering on dell machine
according to the system monitor chart shown on cacti, i don't think IO is heavy, no matter "cpu io wait" and "Reads/Writes - sda".
there is no monitor items showing strange behavior of IO system, and no different between low concurrency and heavy concurrency,
and no different between two environments.
I find something with top : CPU usage of each postgres process is not so high when low concurrency, the highest one is about 50%.
but when concurrency gradually increased, some postgres process cpu usage reach 100%, and keep a moment. and at these high concurrency period runq-sz(with sar -q) is very long, sometime 50 process waiting the CPU time.
so is there something like spin-lock keep the CPU time?
some configurations on the both system:
shared_buffers = 8192MB
work_mem =256MB
maintenance_work_mem = 160MB
full_page_writes = off
wal_buffers = 10MB
wal_keep_segments = 150
hardware configurations list below(both environment with raid 10):
* perfect one:
$ sudo hwconfig
Summary: HP DL360 G7, 1 x Xeon E5645 2.40GHz, 94.4GB / 96GB 1333MHz DDR3
System: HP ProLiant DL360 G7
Processors: 1 (of 2) x Xeon E5645 2.40GHz 133MHz FSB (HT enabled, 6 cores, 24 threads)
Memory: 94.4GB / 96GB 1333MHz DDR3 == 6 x 16GB, 12 x empty
Disk: cciss/c0d0 (cciss0): 1.2TB (48%) RAID-10 == 4 x HP-EG0600FBLSH
Disk-Control: cciss0: Hewlett-Packard Company Smart Array G6 controllers, FW 5.14, Cache on 256MB/768MB (R/W)
Chipset: Intel 82801JIB (ICH10)
Network: eth0 (bnx2): Broadcom NetXtreme II BCM5709 Gigabit, e4:11:5b:ed:12:1c, 1000Mb/s <full-duplex>
Network: eth1 (bnx2): Broadcom NetXtreme II BCM5709 Gigabit, e4:11:5b:ed:12:1e, no carrier
Network: eth2 (bnx2): Broadcom NetXtreme II BCM5709 Gigabit, e4:11:5b:ed:12:58, no carrier
Network: eth3 (bnx2): Broadcom NetXtreme II BCM5709 Gigabit, e4:11:5b:ed:12:5a, no carrier
OS: CentOS 5.6 (Final), Linux 2.6.18-238.19.1.el5 x86_64, 64-bit
BIOS: HP P68 12/02/2012
Hostname: l-interdb3.f.cn1
* the one performances so bad:
$ sudo hwconfig
hwconfig: warning: could not run MegaCli
Summary: Dell R620, 1 x Xeon E5-2630 0 2.30GHz, 62.9GB / 64GB 1600MHz DDR3
System: Dell PowerEdge R620 (Dell 0D2D5F)
Processors: 1 (of 2) x Xeon E5-2630 0 2.30GHz 7200MHz FSB (HT enabled, 6 cores, 24 threads)
Memory: 62.9GB / 64GB 1600MHz DDR3 == 8 x 8GB, 16 x empty
Disk: sda (scsi6): 1.2TB (29%) JBOD == 1 x DELL-PERC-H710P
Disk-Control: ahci0: Intel Patsburg 6-Port SATA AHCI Controller
Disk-Control: megaraid_sas0: LSI Logic / Symbios Logic MegaRAID SAS 2208 [Thunderbolt]
Network: em1 (tg3): Broadcom NetXtreme BCM5720 Gigabit PCIe, e0:db:55:1f:9b:d8, 1000Mb/s <full-duplex>
Network: em2 (tg3): Broadcom NetXtreme BCM5720 Gigabit PCIe, e0:db:55:1f:9b:d9, no carrier
Network: em3 (tg3): Broadcom NetXtreme BCM5720 Gigabit PCIe, e0:db:55:1f:9b:da, no carrier
Network: em4 (tg3): Broadcom NetXtreme BCM5720 Gigabit PCIe, e0:db:55:1f:9b:db, no carrier
OS: CentOS 6.2 (Final), Linux 3.2.34-1.el6.x86_64 x86_64, 64-bit
BIOS: Dell 1.4.8 10/25/2012
Hostname: l-interdb11.f.cn1
2013/12/6 John R Pierce <pierce@hogranch.com>
On 12/5/2013 12:46 AM, 吕晓旭 wrote:I'm curious why you built your own postgres instead of using the yum.postgresql.com repository versions?We find so weird problem on our productive PostgreSQL system. And I don't know how could I do to resolve this problem.
We deployed PostgreSQL 9.2.4 on two system environments, and the performances between them are absolutely different. one of them it's perfect, and the other one lets me down, CPU Usage and LoadAverage Jumped up Suddenly when concurrency smoothly rising up, simultaneously, average response time become unacceptable.
and I second the suggestion, IO performance is likely a major factor here. also, you don't give your postgresql.conf tuning settings, file systems configurations, hardware storage configurations, etc.
--
john r pierce                                      37N 122W
somewhere on the middle of the left coast
--
Sent via pgsql-general mailing list (pgsql-general@postgresql.org)
To make changes to your subscription:
http://www.postgresql.org/mailpref/pgsql-general
On 12/6/2013 11:04 AM, 吕晓旭 wrote:
I find something with top : CPU usage of each postgres process is not so high when low concurrency, the highest one is about 50%.
but when concurrency gradually increased, some postgres process cpu usage reach 100%, and keep a moment. and at these high concurrency period runq-sz(with sar -q) is very long, sometime 50 process waiting the CPU time.
so is there something like spin-lock keep the CPU time?
some configurations on the both system:
shared_buffers = 8192MB
work_mem =256MB
maintenance_work_mem = 160MB
full_page_writes = off
wal_buffers = 10MB
wal_keep_segments = 150
50 concurrent active queries with work_mem = 256MB would use like 13GB ram, or possibly more if the queries are complex and require multiple work_mems. I see you have 64GB ram on the 'slow' system, so that /shouldn't/ be an issue, unless you end up with much higher concurrent query counts.
seems to be a lot of variables here, one system is running CentOS 5.x and the other CentOS 6.x, if I remember correctly from your first post. different memory sizes. different disk controllers. both CentOS versions are quite out of date (5.7 and 6.5 are both direct inplace upgrades). I also recall CentOS 6.2 had some file system bugs relating to XFS, but I dunno if that applies here. hmmmm, kernel 3.2.34 ? thats not the centos 6.2 kernel, where is it from ?
btw, those CPUs have 12 threads, not 24
-- john r pierce 37N 122W somewhere on the middle of the left coast