Обсуждение: pgsql: Add parallel-aware hash joins.
Add parallel-aware hash joins.

Introduce parallel-aware hash joins that appear in EXPLAIN plans as Parallel
Hash Join with Parallel Hash.  While hash joins could already appear in
parallel queries, they were previously always parallel-oblivious and had a
partial subplan only on the outer side, meaning that the work of the inner
subplan was duplicated in every worker.

After this commit, the planner will consider using a partial subplan on the
inner side too, using the Parallel Hash node to divide the work over the
available CPU cores and combine its results in shared memory.  If the join
needs to be split into multiple batches in order to respect work_mem, then
workers process different batches as much as possible and then work together
on the remaining batches.

The advantages of a parallel-aware hash join over a parallel-oblivious hash
join used in a parallel query are that it:

 * avoids wasting memory on duplicated hash tables
 * avoids wasting disk space on duplicated batch files
 * divides the work of building the hash table over the CPUs

One disadvantage is that there is some communication between the participating
CPUs which might outweigh the benefits of parallelism in the case of small
hash tables.  This is avoided by the planner's existing reluctance to supply
partial plans for small scans, but it may be necessary to estimate
synchronization costs in future if that situation changes.  Another is that
outer batch 0 must be written to disk if multiple batches are required.

A potential future advantage of parallel-aware hash joins is that right and
full outer joins could be supported, since there is a single set of matched
bits for each hashtable, but that is not yet implemented.

A new GUC enable_parallel_hash is defined to control the feature, defaulting
to on.

Author: Thomas Munro
Reviewed-By: Andres Freund, Robert Haas
Tested-By: Rafia Sabih, Prabhat Sahu
Discussion:
    https://postgr.es/m/CAEepm=2W=cOkiZxcg6qiFQP-dHUe09aqTrEMM7yJDrHMhDv_RA@mail.gmail.com
    https://postgr.es/m/CAEepm=37HKyJ4U6XOLi=JgfSHM3o6B-GaeO-6hkOmneTDkH+Uw@mail.gmail.com

Branch
------
master

Details
-------
https://git.postgresql.org/pg/commitdiff/1804284042e659e7d16904e7bbb0ad546394b6a3

Modified Files
--------------
doc/src/sgml/config.sgml                      |   15 +
doc/src/sgml/monitoring.sgml                  |   62 +-
src/backend/executor/execParallel.c           |   21 +
src/backend/executor/execProcnode.c           |    3 +
src/backend/executor/nodeHash.c               | 1659 +++++++++++++++++++++++--
src/backend/executor/nodeHashjoin.c           |  617 ++++++++-
src/backend/nodes/copyfuncs.c                 |    1 +
src/backend/nodes/outfuncs.c                  |    1 +
src/backend/nodes/readfuncs.c                 |    1 +
src/backend/optimizer/path/costsize.c         |   25 +-
src/backend/optimizer/path/joinpath.c         |   36 +-
src/backend/optimizer/plan/createplan.c       |   11 +
src/backend/optimizer/util/pathnode.c         |    5 +-
src/backend/postmaster/pgstat.c               |   45 +
src/backend/utils/misc/guc.c                  |   10 +-
src/backend/utils/misc/postgresql.conf.sample |    1 +
src/include/executor/hashjoin.h               |  175 ++-
src/include/executor/nodeHash.h               |   24 +-
src/include/executor/nodeHashjoin.h           |    6 +
src/include/nodes/execnodes.h                 |    6 +
src/include/nodes/plannodes.h                 |    1 +
src/include/nodes/relation.h                  |    2 +
src/include/optimizer/cost.h                  |    4 +-
src/include/optimizer/pathnode.h              |    1 +
src/include/pgstat.h                          |   15 +
src/include/storage/lwlock.h                  |    1 +
src/test/regress/expected/join.out            |  304 ++++-
src/test/regress/expected/sysviews.out        |    3 +-
src/test/regress/sql/join.sql                 |  148 ++-
src/tools/pgindent/typedefs.list              |    4 +
30 files changed, 3091 insertions(+), 116 deletions(-)
On 2017-12-21 08:49:46 +0000, Andres Freund wrote:
> Add parallel-aware hash joins.

There's to relatively mundane failures:
https://buildfarm.postgresql.org/cgi-bin/show_log.pl?nm=tern&dt=2017-12-21%2008%3A48%3A12
https://buildfarm.postgresql.org/cgi-bin/show_log.pl?nm=termite&dt=2017-12-21%2008%3A50%3A08

but also one that's a lot more interesting:
https://buildfarm.postgresql.org/cgi-bin/show_log.pl?nm=capybara&dt=2017-12-21%2008%3A50%3A08

which shows an assert failure:

#2  0x00000000008687d1 in ExceptionalCondition (conditionName=conditionName@entry=0xa76a98
"!(!accessor->sts->participants[i].writing)",errorType=errorType@entry=0x8b2c49 "FailedAssertion",
fileName=fileName@entry=0xa76991"sharedtuplestore.c", lineNumber=lineNumber@entry=273) at assert.c:54

#3  0x000000000089883e in sts_begin_parallel_scan (accessor=0xfaf780) at sharedtuplestore.c:273
#4  0x0000000000634de4 in ExecParallelHashRepartitionRest (hashtable=0xfaec18) at nodeHash.c:1369
#5  ExecParallelHashIncreaseNumBatches (hashtable=0xfaec18) at nodeHash.c:1198
#6  0x000000000063546b in ExecParallelHashTupleAlloc (hashtable=hashtable@entry=0xfaec18, size=40,
shared=shared@entry=0x7ffee26a8868)at nodeHash.c:2778

#7  0x00000000006357c8 in ExecParallelHashTableInsert (hashtable=hashtable@entry=0xfaec18, slot=slot@entry=0xfa76f8,
hashvalue=<optimizedout>) at nodeHash.c:1696

#8  0x0000000000635b5f in MultiExecParallelHash (node=0xf7ebc8) at nodeHash.c:288
#9  MultiExecHash (node=node@entry=0xf7ebc8) at nodeHash.c:112

which seems to suggest that something in the state machine logic is
borked. ExecParallelHashIncreaseNumBatches() should've ensured that
everyone has called sts_end_write()...

Greetings,

Andres Freund
On Thu, Dec 21, 2017 at 10:29 PM, Andres Freund <andres@anarazel.de> wrote:
> On 2017-12-21 08:49:46 +0000, Andres Freund wrote:
>> Add parallel-aware hash joins.
>
> There's to relatively mundane failures:
> https://buildfarm.postgresql.org/cgi-bin/show_log.pl?nm=tern&dt=2017-12-21%2008%3A48%3A12
> https://buildfarm.postgresql.org/cgi-bin/show_log.pl?nm=termite&dt=2017-12-21%2008%3A50%3A08

Right, it looks like something takes more space on ppc systems causing
a batch increase that doesn't happen on amd64.  I'll come back to
that.

> but also one that's a lot more interesting:
> https://buildfarm.postgresql.org/cgi-bin/show_log.pl?nm=capybara&dt=2017-12-21%2008%3A50%3A08
>
> which shows an assert failure:
>
> #2  0x00000000008687d1 in ExceptionalCondition (conditionName=conditionName@entry=0xa76a98
"!(!accessor->sts->participants[i].writing)",errorType=errorType@entry=0x8b2c49 "FailedAssertion",
fileName=fileName@entry=0xa76991"sharedtuplestore.c", lineNumber=lineNumber@entry=273) at assert.c:54
> #3  0x000000000089883e in sts_begin_parallel_scan (accessor=0xfaf780) at sharedtuplestore.c:273
> #4  0x0000000000634de4 in ExecParallelHashRepartitionRest (hashtable=0xfaec18) at nodeHash.c:1369
> #5  ExecParallelHashIncreaseNumBatches (hashtable=0xfaec18) at nodeHash.c:1198
> #6  0x000000000063546b in ExecParallelHashTupleAlloc (hashtable=hashtable@entry=0xfaec18, size=40,
shared=shared@entry=0x7ffee26a8868)at nodeHash.c:2778
> #7  0x00000000006357c8 in ExecParallelHashTableInsert (hashtable=hashtable@entry=0xfaec18, slot=slot@entry=0xfa76f8,
hashvalue=<optimizedout>) at nodeHash.c:1696
> #8  0x0000000000635b5f in MultiExecParallelHash (node=0xf7ebc8) at nodeHash.c:288
> #9  MultiExecHash (node=node@entry=0xf7ebc8) at nodeHash.c:112
>
> which seems to suggest that something in the state machine logic is
> borked. ExecParallelHashIncreaseNumBatches() should've ensured that
> everyone has called sts_end_write()...

Hmm.  This looks the same as the one-off single assertion failure that
I mentioned[1] and had not been able to reproduce.  Investigating.

[1] https://www.postgresql.org/message-id/CAEepm%3D0oE%3DyO0Kam86W1d-iJoasWByYkcrkDoJu6t5mRhFGHkQ%40mail.gmail.com

--
Thomas Munro
http://www.enterprisedb.com
On 2017-12-21 01:29:40 -0800, Andres Freund wrote:
> On 2017-12-21 08:49:46 +0000, Andres Freund wrote:
> > Add parallel-aware hash joins.
>
> There's to relatively mundane failures:
> https://buildfarm.postgresql.org/cgi-bin/show_log.pl?nm=tern&dt=2017-12-21%2008%3A48%3A12
> https://buildfarm.postgresql.org/cgi-bin/show_log.pl?nm=termite&dt=2017-12-21%2008%3A50%3A08
>
> but also one that's a lot more interesting:
> https://buildfarm.postgresql.org/cgi-bin/show_log.pl?nm=capybara&dt=2017-12-21%2008%3A50%3A08
>
> which shows an assert failure:
>
> #2  0x00000000008687d1 in ExceptionalCondition (conditionName=conditionName@entry=0xa76a98
"!(!accessor->sts->participants[i].writing)",errorType=errorType@entry=0x8b2c49 "FailedAssertion",
fileName=fileName@entry=0xa76991"sharedtuplestore.c", lineNumber=lineNumber@entry=273) at assert.c:54

> #3  0x000000000089883e in sts_begin_parallel_scan (accessor=0xfaf780) at sharedtuplestore.c:273
> #4  0x0000000000634de4 in ExecParallelHashRepartitionRest (hashtable=0xfaec18) at nodeHash.c:1369
> #5  ExecParallelHashIncreaseNumBatches (hashtable=0xfaec18) at nodeHash.c:1198
> #6  0x000000000063546b in ExecParallelHashTupleAlloc (hashtable=hashtable@entry=0xfaec18, size=40,
shared=shared@entry=0x7ffee26a8868)at nodeHash.c:2778

> #7  0x00000000006357c8 in ExecParallelHashTableInsert (hashtable=hashtable@entry=0xfaec18, slot=slot@entry=0xfa76f8,
hashvalue=<optimizedout>) at nodeHash.c:1696

> #8  0x0000000000635b5f in MultiExecParallelHash (node=0xf7ebc8) at nodeHash.c:288
> #9  MultiExecHash (node=node@entry=0xf7ebc8) at nodeHash.c:112
>
> which seems to suggest that something in the state machine logic is
> borked. ExecParallelHashIncreaseNumBatches() should've ensured that
> everyone has called sts_end_write()...

Thomas, I wonder if the problem is that PHJ_GROW_BATCHES_ELECTING
updates, via ExecParallelHashJoinSetUpBatches(), HashJoinTable->nbatch,
while other backends also access ->nbatch in
ExecParallelHashCloseBatchAccessors(). Both happens after waiting for
the WAIT_EVENT_HASH_GROW_BATCHES_ELECTING phase.

That'd lead to ExecParallelHashCloseBatchAccessors() likely not finish
writing all batches (because nbatch < nbatch_old), which seems like it'd
explain this?

Greetings,

Andres Freund
On 2017-12-21 01:55:50 -0800, Andres Freund wrote:
> On 2017-12-21 01:29:40 -0800, Andres Freund wrote:
> > On 2017-12-21 08:49:46 +0000, Andres Freund wrote:
> > > Add parallel-aware hash joins.
> >
> > There's to relatively mundane failures:
> > https://buildfarm.postgresql.org/cgi-bin/show_log.pl?nm=tern&dt=2017-12-21%2008%3A48%3A12
> > https://buildfarm.postgresql.org/cgi-bin/show_log.pl?nm=termite&dt=2017-12-21%2008%3A50%3A08
> >
> > but also one that's a lot more interesting:
> > https://buildfarm.postgresql.org/cgi-bin/show_log.pl?nm=capybara&dt=2017-12-21%2008%3A50%3A08
> >
> > which shows an assert failure:
> >
> > #2  0x00000000008687d1 in ExceptionalCondition (conditionName=conditionName@entry=0xa76a98
"!(!accessor->sts->participants[i].writing)",errorType=errorType@entry=0x8b2c49 "FailedAssertion",
fileName=fileName@entry=0xa76991"sharedtuplestore.c", lineNumber=lineNumber@entry=273) at assert.c:54

> > #3  0x000000000089883e in sts_begin_parallel_scan (accessor=0xfaf780) at sharedtuplestore.c:273
> > #4  0x0000000000634de4 in ExecParallelHashRepartitionRest (hashtable=0xfaec18) at nodeHash.c:1369
> > #5  ExecParallelHashIncreaseNumBatches (hashtable=0xfaec18) at nodeHash.c:1198
> > #6  0x000000000063546b in ExecParallelHashTupleAlloc (hashtable=hashtable@entry=0xfaec18, size=40,
shared=shared@entry=0x7ffee26a8868)at nodeHash.c:2778

> > #7  0x00000000006357c8 in ExecParallelHashTableInsert (hashtable=hashtable@entry=0xfaec18,
slot=slot@entry=0xfa76f8,hashvalue=<optimized out>) at nodeHash.c:1696

> > #8  0x0000000000635b5f in MultiExecParallelHash (node=0xf7ebc8) at nodeHash.c:288
> > #9  MultiExecHash (node=node@entry=0xf7ebc8) at nodeHash.c:112
> >
> > which seems to suggest that something in the state machine logic is
> > borked. ExecParallelHashIncreaseNumBatches() should've ensured that
> > everyone has called sts_end_write()...

> Thomas, I wonder if the problem is that PHJ_GROW_BATCHES_ELECTING
> updates, via ExecParallelHashJoinSetUpBatches(), HashJoinTable->nbatch,
> while other backends also access ->nbatch in
> ExecParallelHashCloseBatchAccessors(). Both happens after waiting for
> the WAIT_EVENT_HASH_GROW_BATCHES_ELECTING phase.
>
> That'd lead to ExecParallelHashCloseBatchAccessors() likely not finish
> writing all batches (because nbatch < nbatch_old), which seems like it'd
> explain this?

Trying to debug this I found another issue. I'd placed a sleep(10) in
ExecParallelHashCloseBatchAccessors() and then ctrl-c'ed the server for
some reason. Segfault time:

#0  0x000055bfbac42539 in tas (lock=0x7fcd82ae14ac <error: Cannot access memory at address 0x7fcd82ae14ac>) at
/home/andres/src/postgresql/src/include/storage/s_lock.h:228
#1  0x000055bfbac42b4d in ConditionVariableCancelSleep () at
/home/andres/src/postgresql/src/backend/storage/lmgr/condition_variable.c:173
#2  0x000055bfba8e24ae in AbortTransaction () at /home/andres/src/postgresql/src/backend/access/transam/xact.c:2478
#3  0x000055bfba8e4a2a in AbortOutOfAnyTransaction () at
/home/andres/src/postgresql/src/backend/access/transam/xact.c:4387
#4  0x000055bfba91ed97 in RemoveTempRelationsCallback (code=1, arg=0) at
/home/andres/src/postgresql/src/backend/catalog/namespace.c:4034
#5  0x000055bfbac1bc90 in shmem_exit (code=1) at /home/andres/src/postgresql/src/backend/storage/ipc/ipc.c:228
#6  0x000055bfbac1bb67 in proc_exit_prepare (code=1) at /home/andres/src/postgresql/src/backend/storage/ipc/ipc.c:185
#7  0x000055bfbac1bacf in proc_exit (code=1) at /home/andres/src/postgresql/src/backend/storage/ipc/ipc.c:102
#8  0x000055bfbadbccf0 in errfinish (dummy=0) at /home/andres/src/postgresql/src/backend/utils/error/elog.c:543
#9  0x000055bfbac4eda3 in ProcessInterrupts () at /home/andres/src/postgresql/src/backend/tcop/postgres.c:2917
#10 0x000055bfbac42a63 in ConditionVariableSleep (cv=0x7fcd82ae14ac, wait_event_info=134217742) at
/home/andres/src/postgresql/src/backend/storage/lmgr/condition_variable.c:129
#11 0x000055bfbac18405 in BarrierArriveAndWait (barrier=0x7fcd82ae1494, wait_event_info=134217742) at
/home/andres/src/postgresql/src/backend/storage/ipc/barrier.c:191
#12 0x000055bfbaa9361e in ExecParallelHashIncreaseNumBatches (hashtable=0x55bfbd0e11d0) at
/home/andres/src/postgresql/src/backend/executor/nodeHash.c:1191
#13 0x000055bfbaa962ef in ExecParallelHashTupleAlloc (hashtable=0x55bfbd0e11d0, size=40, shared=0x7ffda8967050) at
/home/andres/src/postgresql/src/backend/executor/nodeHash.c:2781
#14 0x000055bfbaa946e8 in ExecParallelHashTableInsert (hashtable=0x55bfbd0e11d0, slot=0x55bfbd089a80,
hashvalue=3825063138)at /home/andres/src/postgresql/src/backend/executor/nodeHash.c:1699

#15 0x000055bfbaa91d90 in MultiExecParallelHash (node=0x55bfbd089610) at
/home/andres/src/postgresql/src/backend/executor/nodeHash.c:288
#16 0x000055bfbaa919b9 in MultiExecHash (node=0x55bfbd089610) at
/home/andres/src/postgresql/src/backend/executor/nodeHash.c:112
#17 0x000055bfbaa7a500 in MultiExecProcNode (node=0x55bfbd089610) at
/home/andres/src/postgresql/src/backend/executor/execProcnode.c:502
#18 0x000055bfbaa98515 in ExecHashJoinImpl (parallel=1 '\001', pstate=0x55bfbd053d50) at
/home/andres/src/postgresql/src/backend/executor/nodeHashjoin.c:291
#19 ExecParallelHashJoin (pstate=0x55bfbd053d50) at
/home/andres/src/postgresql/src/backend/executor/nodeHashjoin.c:582
#20 0x000055bfbaa7a424 in ExecProcNodeFirst (node=0x55bfbd053d50) at
/home/andres/src/postgresql/src/backend/executor/execProcnode.c:446
#21 0x000055bfbaa858c7 in ExecProcNode (node=0x55bfbd053d50) at
/home/andres/src/postgresql/src/include/executor/executor.h:242
#22 0x000055bfbaa85d67 in fetch_input_tuple (aggstate=0x55bfbd053698) at
/home/andres/src/postgresql/src/backend/executor/nodeAgg.c:699
#23 0x000055bfbaa889b5 in agg_retrieve_direct (aggstate=0x55bfbd053698) at
/home/andres/src/postgresql/src/backend/executor/nodeAgg.c:2355
#24 0x000055bfbaa8858e in ExecAgg (pstate=0x55bfbd053698) at
/home/andres/src/postgresql/src/backend/executor/nodeAgg.c:2166
#25 0x000055bfbaa7a424 in ExecProcNodeFirst (node=0x55bfbd053698) at
/home/andres/src/postgresql/src/backend/executor/execProcnode.c:446
#26 0x000055bfbaa90a4e in ExecProcNode (node=0x55bfbd053698) at
/home/andres/src/postgresql/src/include/executor/executor.h:242
#27 0x000055bfbaa910d5 in gather_getnext (gatherstate=0x55bfbd053340) at
/home/andres/src/postgresql/src/backend/executor/nodeGather.c:285
#28 0x000055bfbaa90f5f in ExecGather (pstate=0x55bfbd053340) at
/home/andres/src/postgresql/src/backend/executor/nodeGather.c:216
#29 0x000055bfbaa7a424 in ExecProcNodeFirst (node=0x55bfbd053340) at
/home/andres/src/postgresql/src/backend/executor/execProcnode.c:446
#30 0x000055bfbaa858c7 in ExecProcNode (node=0x55bfbd053340) at
/home/andres/src/postgresql/src/include/executor/executor.h:242
#31 0x000055bfbaa85d67 in fetch_input_tuple (aggstate=0x55bfbd052c18) at
/home/andres/src/postgresql/src/backend/executor/nodeAgg.c:699
#32 0x000055bfbaa889b5 in agg_retrieve_direct (aggstate=0x55bfbd052c18) at
/home/andres/src/postgresql/src/backend/executor/nodeAgg.c:2355
#33 0x000055bfbaa8858e in ExecAgg (pstate=0x55bfbd052c18) at
/home/andres/src/postgresql/src/backend/executor/nodeAgg.c:2166
#34 0x000055bfbaa7a424 in ExecProcNodeFirst (node=0x55bfbd052c18) at
/home/andres/src/postgresql/src/backend/executor/execProcnode.c:446
#35 0x000055bfbaa716c6 in ExecProcNode (node=0x55bfbd052c18) at
/home/andres/src/postgresql/src/include/executor/executor.h:242
#36 0x000055bfbaa7404e in ExecutePlan (estate=0x55bfbd0529c8, planstate=0x55bfbd052c18, use_parallel_mode=1 '\001',
operation=CMD_SELECT,sendTuples=1 '\001', numberTuples=0, direction=ForwardScanDirection, dest=0x55bfbd121ae0,
execute_once=1'\001')

    at /home/andres/src/postgresql/src/backend/executor/execMain.c:1718
#37 0x000055bfbaa71cba in standard_ExecutorRun (queryDesc=0x55bfbcf0fe68, direction=ForwardScanDirection, count=0,
execute_once=1'\001') at /home/andres/src/postgresql/src/backend/executor/execMain.c:361

#38 0x000055bfbaa71ad4 in ExecutorRun (queryDesc=0x55bfbcf0fe68, direction=ForwardScanDirection, count=0,
execute_once=1'\001') at /home/andres/src/postgresql/src/backend/executor/execMain.c:304
#39 0x000055bfbac52725 in PortalRunSelect (portal=0x55bfbcf56a48, forward=1 '\001', count=0, dest=0x55bfbd121ae0) at
/home/andres/src/postgresql/src/backend/tcop/pquery.c:932
#40 0x000055bfbac523b8 in PortalRun (portal=0x55bfbcf56a48, count=9223372036854775807, isTopLevel=1 '\001', run_once=1
'\001',dest=0x55bfbd121ae0, altdest=0x55bfbd121ae0, completionTag=0x7ffda8967840 "") at
/home/andres/src/postgresql/src/backend/tcop/pquery.c:773
#41 0x000055bfbac4c0a1 in exec_simple_query (query_string=0x55bfbceefaf8 "select count(*) from simple r join
bigger_than_it_lookss using (id);") at /home/andres/src/postgresql/src/backend/tcop/postgres.c:1120

#42 0x000055bfbac505e4 in PostgresMain (argc=1, argv=0x55bfbcf1d178, dbname=0x55bfbcf1cf30 "regression",
username=0x55bfbceec588"andres") at /home/andres/src/postgresql/src/backend/tcop/postgres.c:4139

#43 0x000055bfbabac375 in BackendRun (port=0x55bfbcf120f0) at
/home/andres/src/postgresql/src/backend/postmaster/postmaster.c:4412
#44 0x000055bfbababa74 in BackendStartup (port=0x55bfbcf120f0) at
/home/andres/src/postgresql/src/backend/postmaster/postmaster.c:4084
#45 0x000055bfbaba7d49 in ServerLoop () at /home/andres/src/postgresql/src/backend/postmaster/postmaster.c:1757
#46 0x000055bfbaba72d2 in PostmasterMain (argc=39, argv=0x55bfbcee9e90) at
/home/andres/src/postgresql/src/backend/postmaster/postmaster.c:1365
#47 0x000055bfbaadb49d in main (argc=39, argv=0x55bfbcee9e90) at
/home/andres/src/postgresql/src/backend/main/main.c:228

So, afaics no workers had yet attached, the leader accepted the cancel
interrupt, the dsm segments were destroyed, and as part of cleanup
cv_sleep_target was supposed to be reset, which fails, because it's
memory has since been freed.   Looking at how that can happen.

Greetings,

Andres Freund
On Thu, Dec 21, 2017 at 10:55 PM, Andres Freund <andres@anarazel.de> wrote:
> Thomas, I wonder if the problem is that PHJ_GROW_BATCHES_ELECTING
> updates, via ExecParallelHashJoinSetUpBatches(), HashJoinTable->nbatch,
> while other backends also access ->nbatch in
> ExecParallelHashCloseBatchAccessors(). Both happens after waiting for
> the WAIT_EVENT_HASH_GROW_BATCHES_ELECTING phase.
>
> That'd lead to ExecParallelHashCloseBatchAccessors() likely not finish
> writing all batches (because nbatch < nbatch_old), which seems like it'd
> explain this?

I don't think that's quite it, because it should never have set
'writing' for any batch number >= nbatch.

It's late here, but I'll take this up tomorrow and either find a fix
or figure out how to avoid antisocial noise levels on the build farm
in the meantime.

--
Thomas Munro
http://www.enterprisedb.com
Andres Freund <andres@anarazel.de> writes:
> On 2017-12-21 08:49:46 +0000, Andres Freund wrote:
>> Add parallel-aware hash joins.

> There's to relatively mundane failures:
> https://buildfarm.postgresql.org/cgi-bin/show_log.pl?nm=tern&dt=2017-12-21%2008%3A48%3A12
> https://buildfarm.postgresql.org/cgi-bin/show_log.pl?nm=termite&dt=2017-12-21%2008%3A50%3A08

> [ as well as various assertion crashes ]

I see my machine prairiedog is showing yet another variation, possibly
related to the tern/termite failure, but not the same:

================= pgsql.build/src/test/regress/regression.diffs ===================
*** /Users/buildfarm/bf-data/HEAD/pgsql.build/src/test/regress/expected/join.out    Thu Dec 21 03:55:15 2017
--- /Users/buildfarm/bf-data/HEAD/pgsql.build/src/test/regress/results/join.out    Thu Dec 21 10:56:00 2017
***************
*** 6682,6688 ****
  $$);
   multibatch
  ------------
!  t
  (1 row)

  rollback to settings;
--- 6682,6688 ----
  $$);
   multibatch
  ------------
!  f
  (1 row)

  rollback to settings;

======================================================================

Let me know if you need me to poke into that.

            regards, tom lane
On Fri, Dec 22, 2017 at 1:48 AM, Thomas Munro
<thomas.munro@enterprisedb.com> wrote:
> I don't think that's quite it, because it should never have set
> 'writing' for any batch number >= nbatch.
>
> It's late here, but I'll take this up tomorrow and either find a fix
> or figure out how to avoid antisocial noise levels on the build farm
> in the meantime.

Not there yet but I learned some things and am still working on it.  I
spent a lot of time trying to reproduce the assertion failure, and
succeeded exactly once.  Unfortunately the one time I managed do to
that I'd built with clang -O2 and got a core file that I couldn't get
much useful info out of, and I've been trying to do it again with -O0
ever since without luck.  The time I succeeded, I reproduced it by
creating the tables "simple" and "bigger_than_it_looks" from join.sql
and then doing this in a loop:

  set min_parallel_table_scan_size = 0;
  set parallel_setup_cost = 0;
  set work_mem = '192kB';

  explain analyze select count(*) from simple r join
bigger_than_it_looks s using (id);

The machine that it happened on is resource constrained, and exhibits
another problem: though the above query normally runs in ~20ms,
sometimes it takes several seconds and occasionally much longer.  That
never happens on fast development systems or test servers which run it
quickly every time, and it doesn't happen on my 2 core slow system if
I have only two workers (or one worker + leader).  I dug into that and
figured out what was going wrong and wrote that up separately[1],
because I think it's an independent bug needing to be fixed, not the
root cause here.  However, I think it could easily be contributing to
the timing required to trigger the bug we're looking for.

Andres, your machine francolin crashed -- got a core file?

[1] https://www.postgresql.org/message-id/CAEepm%3D0NWKehYw7NDoUSf8juuKOPRnCyY3vuaSvhrEWsOTAa3w%40mail.gmail.com

--
Thomas Munro
http://www.enterprisedb.com
Hi,

On 2017-12-22 21:16:10 +1300, Thomas Munro wrote:
> Andres, your machine francolin crashed -- got a core file?

Unfortunately not - it appears the buildfarm cleared it away :(

Might try to reproduce it on that machine...

Greetings,

Andres Freund
Thomas Munro <thomas.munro@enterprisedb.com> writes:
> I'll address the instability of the regression test output separately.

If you're still looking for data on that --- prairiedog is able to
reproduce the "multibatch = f" variant about one time in thirty.
I modified the test case to print out the full EXPLAIN ANALYZE output
rather than a heavily filtered version.  Here's a typical successful run:

! explain analyze
    select length(max(s.t))
    from wide left join (select id, coalesce(t, '') || '' as t from wide) s using (id);
!                                                                    QUERY PLAN

!
------------------------------------------------------------------------------------------------------------------------------------------------
!  Finalize Aggregate  (cost=97.49..97.51 rows=1 width=4) (actual time=409.330..409.331 rows=1 loops=1)
!    ->  Gather  (cost=97.28..97.49 rows=2 width=32) (actual time=376.957..395.841 rows=3 loops=1)
!          Workers Planned: 2
!          Workers Launched: 2
!          ->  Partial Aggregate  (cost=97.28..97.29 rows=1 width=32) (actual time=254.370..254.373 rows=1 loops=3)
!                ->  Parallel Hash Left Join  (cost=23.23..88.88 rows=3360 width=32) (actual time=240.812..241.297
rows=1loops=3)
!                      Hash Cond: (wide.id = wide_1.id)
!                      ->  Parallel Seq Scan on wide  (cost=0.00..15.29 rows=529 width=4) (actual time=0.066..0.075
rows=1loops=3)
!                      ->  Parallel Hash  (cost=16.61..16.61 rows=529 width=36) (actual time=109.565..109.565 rows=1
loops=3)
!                            Buckets: 1024 (originally 2048)  Batches: 8 (originally 1)  Memory Usage: 321kB
!                            ->  Parallel Seq Scan on wide wide_1  (cost=0.00..16.61 rows=529 width=36) (actual
time=2.989..7.218rows=1 loops=3)
!  Planning time: 1.317 ms
!  Execution time: 424.395 ms
! (13 rows)

and here's a failing run:

! explain analyze
    select length(max(s.t))
    from wide left join (select id, coalesce(t, '') || '' as t from wide) s using (id);
!                                                                    QUERY PLAN

!
-------------------------------------------------------------------------------------------------------------------------------------------------
!  Finalize Aggregate  (cost=97.49..97.51 rows=1 width=4) (actual time=232.440..232.441 rows=1 loops=1)
!    ->  Gather  (cost=97.28..97.49 rows=2 width=32) (actual time=225.738..226.744 rows=3 loops=1)
!          Workers Planned: 2
!          Workers Launched: 2
!          ->  Partial Aggregate  (cost=97.28..97.29 rows=1 width=32) (actual time=29.377..29.379 rows=1 loops=3)
!                ->  Parallel Hash Left Join  (cost=23.23..88.88 rows=3360 width=32) (actual time=22.747..25.340 rows=1
loops=3)
!                      Hash Cond: (wide.id = wide_1.id)
!                      ->  Parallel Seq Scan on wide  (cost=0.00..15.29 rows=529 width=4) (actual time=0.086..0.113
rows=2loops=1)
!                      ->  Parallel Hash  (cost=16.61..16.61 rows=529 width=36) (actual time=16.382..16.382 rows=1
loops=3)
!                            Buckets: 1024 (originally 2048)  Batches: 1 (originally 1)  Memory Usage: 0kB
!                            ->  Parallel Seq Scan on wide wide_1  (cost=0.00..16.61 rows=529 width=36) (actual
time=9.167..21.301rows=2 loops=1)
!  Planning time: 1.289 ms
!  Execution time: 243.120 ms
! (13 rows)

I don't have enough insight to be totally sure what this means, but the
"Memory Usage: 0kB" bit is obviously bogus, so I'd venture that at least
part of the issue is failure to return stats from a worker.  I also find
it most curious that the "success" case is a lot slower than the "not
success" case.  Perhaps this is related to your livelock issue?  Doing
another run, I get something even slower:

! explain analyze
    select length(max(s.t))
    from wide left join (select id, coalesce(t, '') || '' as t from wide) s using (id);
!                                                                    QUERY PLAN

!
-------------------------------------------------------------------------------------------------------------------------------------------------
!  Finalize Aggregate  (cost=97.49..97.51 rows=1 width=4) (actual time=487.245..487.246 rows=1 loops=1)
!    ->  Gather  (cost=97.28..97.49 rows=2 width=32) (actual time=444.650..475.390 rows=3 loops=1)
!          Workers Planned: 2
!          Workers Launched: 2
!          ->  Partial Aggregate  (cost=97.28..97.29 rows=1 width=32) (actual time=345.816..345.819 rows=1 loops=3)
!                ->  Parallel Hash Left Join  (cost=23.23..88.88 rows=3360 width=32) (actual time=334.229..338.098
rows=1loops=3)
!                      Hash Cond: (wide.id = wide_1.id)
!                      ->  Parallel Seq Scan on wide  (cost=0.00..15.29 rows=529 width=4) (actual time=0.065..0.074
rows=1loops=3)
!                      ->  Parallel Hash  (cost=16.61..16.61 rows=529 width=36) (actual time=140.210..140.210 rows=1
loops=3)
!                            Buckets: 1024 (originally 2048)  Batches: 8 (originally 1)  Memory Usage: 321kB
!                            ->  Parallel Seq Scan on wide wide_1  (cost=0.00..16.61 rows=529 width=36) (actual
time=4.233..15.117rows=1 loops=3)
!  Planning time: 1.380 ms
!  Execution time: 509.607 ms
! (13 rows)


Aside from the instability problems, I'm pretty unhappy about how much
the PHJ patch has added to the runtime of "make check".  I do not think
any one feature can justify adding 20% to that.  Can't you cut down the
amount of data processed by these new test cases?

            regards, tom lane
On Thu, Dec 28, 2017 at 3:32 PM, Tom Lane <tgl@sss.pgh.pa.us> wrote:
> Thomas Munro <thomas.munro@enterprisedb.com> writes:
>> I'll address the instability of the regression test output separately.
>
> If you're still looking for data on that --- prairiedog is able to
> reproduce the "multibatch = f" variant about one time in thirty.
> I modified the test case to print out the full EXPLAIN ANALYZE output
> rather than a heavily filtered version.  Here's a typical successful run:
>
> !                            Buckets: 1024 (originally 2048)  Batches: 8 (originally 1)  Memory Usage: 321kB
> !  Execution time: 424.395 ms
>
> and here's a failing run:
>
> !                            Buckets: 1024 (originally 2048)  Batches: 1 (originally 1)  Memory Usage: 0kB
> !  Execution time: 243.120 ms
>
> I don't have enough insight to be totally sure what this means, but the
> "Memory Usage: 0kB" bit is obviously bogus, so I'd venture that at least
> part of the issue is failure to return stats from a worker.

Hmm.  Yeah, that seems quite likely -- thanks.  Investigating now.

> I also find
> it most curious that the "success" case is a lot slower than the "not
> success" case.  Perhaps this is related to your livelock issue?  Doing
> another run, I get something even slower:
>
> !                            Buckets: 1024 (originally 2048)  Batches: 8 (originally 1)  Memory Usage: 321kB
> !  Execution time: 509.607 ms

Yes, that looks a lot like the ConditionVariableBroadcast() livelock
problem.  That query with the same 8-batch 2-worker plan runs in ~12ms
and ~19ms for me on two different machines here without the run-to-run
variation you see.

> Aside from the instability problems, I'm pretty unhappy about how much
> the PHJ patch has added to the runtime of "make check".  I do not think
> any one feature can justify adding 20% to that.  Can't you cut down the
> amount of data processed by these new test cases?

Isn't that mostly because of the CV livelock problem?  Here are the
real times I got with "time make check" on my slow 2 core Intel(R)
Celeron(R) CPU G1610T @ 2.30GHz running FreeBSD, which seems to be
prone to that problem on certain queries:

84940644 = 34.83s (before hash join regression tests)
fa330f9a = 35.81s (hash join regression tests)
18042840 = 44.92s (parallel-aware hash joins + new tests)

So the PHJ patch made it take 25% longer, similar to what you
reported.  But then if I apply the following band-aid kludge to
condition_variable.c to limit the looping, I get:

-       while (ConditionVariableSignal(cv))
+       while (nwoken < max_parallel_workers && ConditionVariableSignal(cv))
                ++nwoken;

18042840 + kludge = 36.70s

So without the effects of that bug it's only taking 2.4% longer than
commit fa330f9a.  Is that acceptable for a feature of this size and
complexity?  I will also look into making the data sets smaller.

--
Thomas Munro
http://www.enterprisedb.com
Thomas Munro <thomas.munro@enterprisedb.com> writes:
> On Thu, Dec 28, 2017 at 3:32 PM, Tom Lane <tgl@sss.pgh.pa.us> wrote:
>> Aside from the instability problems, I'm pretty unhappy about how much
>> the PHJ patch has added to the runtime of "make check".  I do not think
>> any one feature can justify adding 20% to that.  Can't you cut down the
>> amount of data processed by these new test cases?

> Isn't that mostly because of the CV livelock problem?

Hm, maybe.  I quoted the 20% figure on the basis of longfin's reports,
not prairiedog's ... but it might be seeing some of the livelock effect
too.

> So without the effects of that bug it's only taking 2.4% longer than
> commit fa330f9a.  Is that acceptable for a feature of this size and
> complexity?  I will also look into making the data sets smaller.

That sounds better, but it's still worth asking whether the tests
could be quicker.

            regards, tom lane
On Thu, Dec 28, 2017 at 5:15 PM, Thomas Munro
<thomas.munro@enterprisedb.com> wrote:
> On Thu, Dec 28, 2017 at 3:32 PM, Tom Lane <tgl@sss.pgh.pa.us> wrote:
>> !                            Buckets: 1024 (originally 2048)  Batches: 1 (originally 1)  Memory Usage: 0kB
>> !  Execution time: 243.120 ms
>>
>> I don't have enough insight to be totally sure what this means, but the
>> "Memory Usage: 0kB" bit is obviously bogus, so I'd venture that at least
>> part of the issue is failure to return stats from a worker.
>
> Hmm.  Yeah, that seems quite likely -- thanks.  Investigating now.

This is explained by the early exit case in
ExecParallelHashEnsureBatchAccessors().  With just the right timing,
it finishes up not reporting the true nbatch number, and never calling
ExecParallelHashUpdateSpacePeak().

In my patch for commit 5bcf389e (before PHJ), I had extracted and
rejiggered some parts of my PHJ work to fix a problem with EXPLAIN for
parallel-oblivious hash joins running in parallel queries, but I
failed to readapt it properly for PHJ.  EXPLAIN needs to scan all
participants' HashInstrumentation to collect the greatest space
report, not just the first one it finds.  I'll test and post a patch
to fix this tomorrow.

--
Thomas Munro
http://www.enterprisedb.com
On Fri, Dec 29, 2017 at 2:21 AM, Thomas Munro
<thomas.munro@enterprisedb.com> wrote:
> On Thu, Dec 28, 2017 at 5:15 PM, Thomas Munro
> <thomas.munro@enterprisedb.com> wrote:
>> On Thu, Dec 28, 2017 at 3:32 PM, Tom Lane <tgl@sss.pgh.pa.us> wrote:
>>> !                            Buckets: 1024 (originally 2048)  Batches: 1 (originally 1)  Memory Usage: 0kB
>>> !  Execution time: 243.120 ms
>>>
>>> I don't have enough insight to be totally sure what this means, but the
>>> "Memory Usage: 0kB" bit is obviously bogus, so I'd venture that at least
>>> part of the issue is failure to return stats from a worker.
>>
>> Hmm.  Yeah, that seems quite likely -- thanks.  Investigating now.
>
> This is explained by the early exit case in
> ExecParallelHashEnsureBatchAccessors().  With just the right timing,
> it finishes up not reporting the true nbatch number, and never calling
> ExecParallelHashUpdateSpacePeak().

Hi Tom,

You mentioned that prairiedog sees the problem about one time in
thirty.  Would you mind checking if it goes away with this patch
applied?

--
Thomas Munro
http://www.enterprisedb.com
Вложения
Hi,

On 2017-12-31 02:51:26 +1300, Thomas Munro wrote:
> You mentioned that prairiedog sees the problem about one time in
> thirty.  Would you mind checking if it goes away with this patch
> applied?
>
> --
> Thomas Munro
> http://www.enterprisedb.com

> From cbed027275039cc5debf8db89342a133a831c9ca Mon Sep 17 00:00:00 2001
> From: Thomas Munro <thomas.munro@enterprisedb.com>
> Date: Sun, 31 Dec 2017 02:03:07 +1300
> Subject: [PATCH] Fix EXPLAIN ANALYZE output for Parallel Hash.
>
> In a race case, EXPLAIN ANALYZE could fail to display correct nbatch and size
> information.  Refactor so that participants report only on batches they worked
> on rather than trying to report on all of them, and teach explain.c to
> consider the HashInstrumentation object from all participants instead of
> picking the first one it can find.  This should fix an occasional build farm
> failure in the "join" regression test.

This seems buggy independent of whether it fixes the issue on prairedog,
right? So I'm inclined to go ahead and just fix it...


> +    /*
> +     * Merge results from workers.  In the parallel-oblivious case, the
> +     * results from all participants should be identical, except where
> +     * participants didn't run the join at all so have no data.  In the
> +     * parallel-aware case, we need to aggregate the results.  Each worker may
> +     * have seen a different subset of batches and we want to report the peak
> +     * memory usage across all batches.
> +     */

It's not necessarily the peak though, right? The largest batches might
not be read in at the same time. I'm fine with approximating it as such,
just want to make sure I understand.


> +    if (hashstate->shared_info)
>      {
>          SharedHashInfo *shared_info = hashstate->shared_info;
>          int        i;
>
> -        /* Find the first worker that built a hash table. */
>          for (i = 0; i < shared_info->num_workers; ++i)
>          {
> -            if (shared_info->hinstrument[i].nbatch > 0)
> +            HashInstrumentation *worker_hi = &shared_info->hinstrument[i];
> +
> +            if (worker_hi->nbatch > 0)
>              {
> -                hinstrument = &shared_info->hinstrument[i];
> -                break;
> +                /*
> +                 * Every participant should agree on the buckets, so to be
> +                 * sure we have a value we'll just overwrite each time.
> +                 */
> +                hinstrument.nbuckets = worker_hi->nbuckets;
> +                hinstrument.nbuckets_original = worker_hi->nbuckets_original;
> +                /*
> +                 * Normally every participant should agree on the number of
> +                 * batches too, but it's possible for a backend that started
> +                 * late and missed the whole join not to have the final nbatch
> +                 * number.  So we'll take the largest number.
> +                 */
> +                hinstrument.nbatch = Max(hinstrument.nbatch, worker_hi->nbatch);
> +                hinstrument.nbatch_original = worker_hi->nbatch_original;
> +                /*
> +                 * In a parallel-aware hash join, for now we report the
> +                 * maximum peak memory reported by any worker.
> +                 */
> +                hinstrument.space_peak =
> +                    Max(hinstrument.space_peak, worker_hi->space_peak);

I bet pgindent will not like this layout.

Ho hum. Is this really, as you say above, an "aggregate the results"?


Greetings,

Andres Freund
On Sun, Dec 31, 2017 at 5:16 AM, Andres Freund <andres@anarazel.de> wrote:
>> In a race case, EXPLAIN ANALYZE could fail to display correct nbatch and size
>> information.  Refactor so that participants report only on batches they worked
>> on rather than trying to report on all of them, and teach explain.c to
>> consider the HashInstrumentation object from all participants instead of
>> picking the first one it can find.  This should fix an occasional build farm
>> failure in the "join" regression test.
>
> This seems buggy independent of whether it fixes the issue on prairedog,
> right? So I'm inclined to go ahead and just fix it...

+1

>> +     /*
>> +      * Merge results from workers.  In the parallel-oblivious case, the
>> +      * results from all participants should be identical, except where
>> +      * participants didn't run the join at all so have no data.  In the
>> +      * parallel-aware case, we need to aggregate the results.  Each worker may
>> +      * have seen a different subset of batches and we want to report the peak
>> +      * memory usage across all batches.
>> +      */
>
> It's not necessarily the peak though, right? The largest batches might
> not be read in at the same time. I'm fine with approximating it as such,
> just want to make sure I understand.

Yeah, it's not attempting to report the true simultaneous peak memory
usage.  It's only reporting the largest individual hash table ever
loaded.  In a multi-batch join more than one hash table may be loaded
at the same time -- up to the number of participants -- but I'm not
yet attempting to reflect that.  On the one hand, that's a bit like
the way we show the size for parallel-oblivious hash joins: each
participant used the reported amount of memory at approximately the
same time.  On the other hand, the total simultaneous memory usage for
parallel-aware hash join is capped by both nbatch and nparticipants:
the true simultaneous peak must be <= largest_hash_table * Min(nbatch,
nparticipants).  I considered various ways to capture and report this
(see the 0007 patch in the v26 patchset, which showed per-worker
information separately, but I abandoned that patch because it was
useless and confusing; another idea would be to report the sum of the
nparticipants largest hash tables, or just assume all batches are
similarly sized and use the formula I gave above, and another would be
to actually track which hash tables or memory regions that were
simultaneously loaded with an incremental shared counter maintained
when hash chunks and bucket arrays are allocated and freed), but
figured we should just go with something super simple for now and then
discuss better ideas as a later evolution.

>> [code]
>
> I bet pgindent will not like this layout.

pgindented.

> Ho hum. Is this really, as you say above, an "aggregate the results"?

Yeah, misleading/stupid use of "aggregate" (SQL MAX() is an
aggregate...).  Offending word removed.

--
Thomas Munro
http://www.enterprisedb.com
Вложения
Thomas Munro <thomas.munro@enterprisedb.com> writes:
>> This is explained by the early exit case in
>> ExecParallelHashEnsureBatchAccessors().  With just the right timing,
>> it finishes up not reporting the true nbatch number, and never calling
>> ExecParallelHashUpdateSpacePeak().

> Hi Tom,

> You mentioned that prairiedog sees the problem about one time in
> thirty.  Would you mind checking if it goes away with this patch
> applied?

I've run 55 cycles of "make installcheck" without seeing a failure
with this patch installed.  That's not enough to be totally sure
of course, but I think this probably fixes it.

However ... I noticed that my other dinosaur gaur shows the other failure
mode we see in the buildfarm, the "increased_batches = t" diff, and
I can report that this patch does *not* help that.  The underlying
EXPLAIN output goes from something like

!  Finalize Aggregate  (cost=823.85..823.86 rows=1 width=8) (actual time=1378.102..1378.105 rows=1 loops=1)
!    ->  Gather  (cost=823.63..823.84 rows=2 width=8) (actual time=1377.909..1378.006 rows=3 loops=1)
!          Workers Planned: 2
!          Workers Launched: 2
!          ->  Partial Aggregate  (cost=823.63..823.64 rows=1 width=8) (actual time=1280.298..1280.302 rows=1 loops=3)
!                ->  Parallel Hash Join  (cost=387.50..802.80 rows=8333 width=0) (actual time=1070.179..1249.142
rows=6667loops=3)
!                      Hash Cond: (r.id = s.id)
!                      ->  Parallel Seq Scan on simple r  (cost=0.00..250.33 rows=8333 width=4) (actual
time=0.173..62.063rows=6667 loops=3)
!                      ->  Parallel Hash  (cost=250.33..250.33 rows=8333 width=4) (actual time=454.305..454.305
rows=6667loops=3)
!                            Buckets: 4096  Batches: 8  Memory Usage: 208kB
!                            ->  Parallel Seq Scan on simple s  (cost=0.00..250.33 rows=8333 width=4) (actual
time=0.178..67.115rows=6667 loops=3)
!  Planning time: 1.861 ms
!  Execution time: 1687.311 ms

to something like

!  Finalize Aggregate  (cost=823.85..823.86 rows=1 width=8) (actual time=1588.733..1588.737 rows=1 loops=1)
!    ->  Gather  (cost=823.63..823.84 rows=2 width=8) (actual time=1588.529..1588.634 rows=3 loops=1)
!          Workers Planned: 2
!          Workers Launched: 2
!          ->  Partial Aggregate  (cost=823.63..823.64 rows=1 width=8) (actual time=1492.631..1492.635 rows=1 loops=3)
!                ->  Parallel Hash Join  (cost=387.50..802.80 rows=8333 width=0) (actual time=1270.309..1451.501
rows=6667loops=3)
!                      Hash Cond: (r.id = s.id)
!                      ->  Parallel Seq Scan on simple r  (cost=0.00..250.33 rows=8333 width=4) (actual
time=0.219..158.144rows=6667 loops=3)
!                      ->  Parallel Hash  (cost=250.33..250.33 rows=8333 width=4) (actual time=634.614..634.614
rows=6667loops=3)
!                            Buckets: 4096 (originally 4096)  Batches: 16 (originally 8)  Memory Usage: 176kB
!                            ->  Parallel Seq Scan on simple s  (cost=0.00..250.33 rows=8333 width=4) (actual
time=0.182..120.074rows=6667 loops=3)
!  Planning time: 1.931 ms
!  Execution time: 2219.417 ms

so again we have a case where the plan didn't change but the execution
behavior did.  This isn't quite 100% reproducible on gaur/pademelon,
but it fails more often than not seems like, so I can poke into it
if you can say what info would be helpful.

            regards, tom lane
On Sun, Dec 31, 2017 at 11:34 AM, Tom Lane <tgl@sss.pgh.pa.us> wrote:
> Thomas Munro <thomas.munro@enterprisedb.com> writes:
>> You mentioned that prairiedog sees the problem about one time in
>> thirty.  Would you mind checking if it goes away with this patch
>> applied?
>
> I've run 55 cycles of "make installcheck" without seeing a failure
> with this patch installed.  That's not enough to be totally sure
> of course, but I think this probably fixes it.

Thanks!

> However ... I noticed that my other dinosaur gaur shows the other failure
> mode we see in the buildfarm, the "increased_batches = t" diff, and
> I can report that this patch does *not* help that.  The underlying
> EXPLAIN output goes from something like
>
> !                            Buckets: 4096  Batches: 8  Memory Usage: 208kB
>
> to something like
>
> !                            Buckets: 4096 (originally 4096)  Batches: 16 (originally 8)  Memory Usage: 176kB
>
> so again we have a case where the plan didn't change but the execution
> behavior did.  This isn't quite 100% reproducible on gaur/pademelon,
> but it fails more often than not seems like, so I can poke into it
> if you can say what info would be helpful.

Right.  That's apparently unrelated and is the last build-farm issue
on my list (so far).  I had noticed that certain BF animals are prone
to that particular failure, and they mostly have architectures that I
don't have so a few things are probably just differently sized.  At
first I thought I'd tweak the tests so that the parameters were always
stable, and I got as far as installing Debian on qemu-system-ppc (it
took a looong time to compile PostgreSQL), but that seems a bit cheap
and flimsy... better to fix the size estimation error.

I assume that what happens here is the planner's size estimation code
sometimes disagrees with Parallel Hash's chunk-based memory
accounting, even though in this case we had perfect tuple count and
tuple size information.  In an earlier version of the patch set I
refactored the planner to be chunk-aware (even for parallel-oblivious
hash join), but later in the process I tried to simplify and shrink
the patch set and avoid making unnecessary changes to non-Parallel
Hash code paths.  I think I'll need to make the planner aware of the
maximum amount of fragmentation possible when parallel-aware
(something like: up to one tuple's worth at the end of each chunk, and
up to one whole wasted chunk per participating backend).  More soon.

--
Thomas Munro
http://www.enterprisedb.com
Thomas Munro <thomas.munro@enterprisedb.com> writes:
> On Sun, Dec 31, 2017 at 11:34 AM, Tom Lane <tgl@sss.pgh.pa.us> wrote:
>> ... This isn't quite 100% reproducible on gaur/pademelon,
>> but it fails more often than not seems like, so I can poke into it
>> if you can say what info would be helpful.

> Right.  That's apparently unrelated and is the last build-farm issue
> on my list (so far).  I had noticed that certain BF animals are prone
> to that particular failure, and they mostly have architectures that I
> don't have so a few things are probably just differently sized.  At
> first I thought I'd tweak the tests so that the parameters were always
> stable, and I got as far as installing Debian on qemu-system-ppc (it
> took a looong time to compile PostgreSQL), but that seems a bit cheap
> and flimsy... better to fix the size estimation error.

"Size estimation error"?  Why do you think it's that?  We have exactly
the same plan in both cases.

My guess is that what's happening is that one worker or the other ends
up processing the whole scan, or the vast majority of it, so that that
worker's hash table has to hold substantially more than half of the
tuples and thereby is forced to up the number of batches.  I don't see
how you can expect to estimate that situation exactly; or if you do,
you'll be pessimizing the plan for cases where the split is more nearly
equal.

By this theory, the reason why certain BF members are more prone to the
failure is that they're single-processor machines, and perhaps have
kernels with relatively long scheduling quanta, so that it's more likely
that the worker that gets scheduled first is able to read the whole input
to the hash step.

> I assume that what happens here is the planner's size estimation code
> sometimes disagrees with Parallel Hash's chunk-based memory
> accounting, even though in this case we had perfect tuple count and
> tuple size information.  In an earlier version of the patch set I
> refactored the planner to be chunk-aware (even for parallel-oblivious
> hash join), but later in the process I tried to simplify and shrink
> the patch set and avoid making unnecessary changes to non-Parallel
> Hash code paths.  I think I'll need to make the planner aware of the
> maximum amount of fragmentation possible when parallel-aware
> (something like: up to one tuple's worth at the end of each chunk, and
> up to one whole wasted chunk per participating backend).  More soon.

I'm really dubious that trying to model the executor's space consumption
exactly is a good idea, even if it did fix this specific problem.
That would expend extra planner cycles and pose a continuing maintenance
gotcha.

            regards, tom lane
On 2017-12-31 10:59:26 +1300, Thomas Munro wrote:
> On Sun, Dec 31, 2017 at 5:16 AM, Andres Freund <andres@anarazel.de> wrote:
> >> In a race case, EXPLAIN ANALYZE could fail to display correct nbatch and size
> >> information.  Refactor so that participants report only on batches they worked
> >> on rather than trying to report on all of them, and teach explain.c to
> >> consider the HashInstrumentation object from all participants instead of
> >> picking the first one it can find.  This should fix an occasional build farm
> >> failure in the "join" regression test.
> >
> > This seems buggy independent of whether it fixes the issue on prairedog,
> > right? So I'm inclined to go ahead and just fix it...
>
> +1

Pushed your updated version.

Thanks,

Andres
On Tue, Jan 2, 2018 at 11:42 AM, Andres Freund <andres@anarazel.de> wrote:
> Pushed your updated version.

Thanks.  That should leave just the test failures like this on certain machines:

*** 6103,6109 ****
  $$);
   initially_multibatch | increased_batches
  ----------------------+-------------------
!  t                    | f
  (1 row)

  rollback to settings;
--- 6103,6109 ----
  $$);
   initially_multibatch | increased_batches
  ----------------------+-------------------
!  t                    | t
  (1 row)

I'll post a patch that should fix that along with a reply to Tom's
most recent email tomorrow, when I'm back from my break.

--
Thomas Munro
http://www.enterprisedb.com
On Sun, Dec 31, 2017 at 1:00 PM, Tom Lane <tgl@sss.pgh.pa.us> wrote:
>> Right.  That's apparently unrelated and is the last build-farm issue
>> on my list (so far).  I had noticed that certain BF animals are prone
>> to that particular failure, and they mostly have architectures that I
>> don't have so a few things are probably just differently sized.  At
>> first I thought I'd tweak the tests so that the parameters were always
>> stable, and I got as far as installing Debian on qemu-system-ppc (it
>> took a looong time to compile PostgreSQL), but that seems a bit cheap
>> and flimsy... better to fix the size estimation error.
>
> "Size estimation error"?  Why do you think it's that?  We have exactly
> the same plan in both cases.

I mean that ExecChooseHashTableSize() estimates the hash table size like this:

    inner_rel_bytes = ntuples * tupsize;

... but then at execution time, in the Parallel Hash case, we do
memory accounting not in tuples but in chunks.  The various
participants pack tuples into 32KB chunks, and they trigger an
increase in the number of batches when the total size of all chunks
happens to exceeds the memory budget.  In this case they do so
unexpectedly due to that extra overhead at execution time that the
planner didn't account for.  We happened to be close to the threshold,
in this case between choosing 8 batches and 16 batches, we can get it
wrong and have to increase nbatch at execution time.

Non-parallel Hash also has such fragmentation.  There are headers +
extra space at the end of each chunk, especially the end of the final
chunk.  But it doesn't matter there because the executor doesn't count
the overhead either.  For Parallel Hash I count the overhead, because
it reduces IPC if I do all the accounting in 32KB chunks.

I'm torn between (1) posting a patch that teaches
ExecChooseHashTableSize() to estimate the worst case extra
fragmentation assuming all participants contribute an almost entirely
empty chunk at the end, and (2) just finding some parameters (ie tweak
work_mem or number of tuples) that will make this work on all
computers in the build farm.  I think the former is the correct
solution.  Another solution would be to teach the executor to discount
the overhead, but that seems hard and seems like it's travelling in
the wrong direction.

> My guess is that what's happening is that one worker or the other ends
> up processing the whole scan, or the vast majority of it, so that that
> worker's hash table has to hold substantially more than half of the
> tuples and thereby is forced to up the number of batches.  I don't see
> how you can expect to estimate that situation exactly; or if you do,
> you'll be pessimizing the plan for cases where the split is more nearly
> equal.

That sort of thing does indeed affect the size at execution.  You can
see that run to run variation easily with a small join forced to use
Parallel Hash, so that there is a race to load tuples.  You get a
larger size if more workers manage to load at least one tuple, due to
their final partially filled chunk.

There is also the question of this being underestimated on systems
without real atomics:

    bucket_bytes = sizeof(HashJoinTuple) * nbuckets;

The real size at execution time is sizeof(dsa_pointer_atomic) *
nbuckets.  I don't think that's responsible for this particular
underestimation problem because the bucket array is currently not
considered at execution time when deciding to increase batches -- it
should be, and I'll come back to those two problems separately.

--
Thomas Munro
http://www.enterprisedb.com
Thomas Munro <thomas.munro@enterprisedb.com> writes:
> On Sun, Dec 31, 2017 at 1:00 PM, Tom Lane <tgl@sss.pgh.pa.us> wrote:
>> "Size estimation error"?  Why do you think it's that?  We have exactly
>> the same plan in both cases.

> I mean that ExecChooseHashTableSize() estimates the hash table size like this:
>     inner_rel_bytes = ntuples * tupsize;

> ... but then at execution time, in the Parallel Hash case, we do
> memory accounting not in tuples but in chunks.  The various
> participants pack tuples into 32KB chunks, and they trigger an
> increase in the number of batches when the total size of all chunks
> happens to exceeds the memory budget.  In this case they do so
> unexpectedly due to that extra overhead at execution time that the
> planner didn't account for.  We happened to be close to the threshold,
> in this case between choosing 8 batches and 16 batches, we can get it
> wrong and have to increase nbatch at execution time.

If that's the issue, why doesn't the test fail every time on affected
platforms?  There shouldn't be anything nondeterministic about the
number or size of tuples going into the hash table?

> ... You get a
> larger size if more workers manage to load at least one tuple, due to
> their final partially filled chunk.

Hm.  That could do it, except it doesn't really account for the observed
result that slower single-processor machines seem more prone to the
bug.  Surely they should be less likely to get multiple workers activated.

BTW, I'm seeing a few things that look bug-like about
ExecParallelHashTuplePrealloc, for instance why does it use just
"size" to decide if space_allowed is exceeded but if not then add the
typically-much-larger value "want + HASH_CHUNK_HEADER_SIZE" to
estimated_size.  That clearly can allow estimated_size to get
significantly past space_allowed --- if it's not a bug, it at least
deserves a comment explaining why not.  Another angle, which does not
apply to this test case but seems like a bug for real usage, is that
ExecParallelHashTuplePrealloc doesn't account correctly for tuples wider
than HASH_CHUNK_THRESHOLD.

I'm also wondering why the non-parallel path seems to prefer to allocate
in units of HASH_CHUNK_SIZE + HASH_CHUNK_HEADER_SIZE while the parallel
path targets allocations of exactly HASH_CHUNK_SIZE, and why there's such
inconsistency in whether tuples of exactly HASH_CHUNK_THRESHOLD bytes
are treated as "big" or not.

            regards, tom lane
On Wed, Jan 3, 2018 at 2:38 PM, Tom Lane <tgl@sss.pgh.pa.us> wrote:
> Thomas Munro <thomas.munro@enterprisedb.com> writes:
>> I mean that ExecChooseHashTableSize() estimates the hash table size like this:
>>     inner_rel_bytes = ntuples * tupsize;
>
>> ... but then at execution time, in the Parallel Hash case, we do
>> memory accounting not in tuples but in chunks.  The various
>> participants pack tuples into 32KB chunks, and they trigger an
>> increase in the number of batches when the total size of all chunks
>> happens to exceeds the memory budget.  In this case they do so
>> unexpectedly due to that extra overhead at execution time that the
>> planner didn't account for.  We happened to be close to the threshold,
>> in this case between choosing 8 batches and 16 batches, we can get it
>> wrong and have to increase nbatch at execution time.
>
> If that's the issue, why doesn't the test fail every time on affected
> platforms?  There shouldn't be anything nondeterministic about the
> number or size of tuples going into the hash table?
>
>> ... You get a
>> larger size if more workers manage to load at least one tuple, due to
>> their final partially filled chunk.
>
> Hm.  That could do it, except it doesn't really account for the observed
> result that slower single-processor machines seem more prone to the
> bug.  Surely they should be less likely to get multiple workers activated.

I can reproduce the instability here with an -m32 build and this:

  create table simple as
    select generate_series(1, 20000) AS id,
'aaaaaaaaaaaaaaaaaaaaaaaaaaaaaaaaaa';
  alter table simple set (parallel_workers = 2);
  analyze simple;

  set parallel_setup_cost = 0;
  set work_mem = '96kB';

  explain analyze select count(*) from simple r join simple s using
(id);

It plans for 8 batches, and then usually but not always goes to 16 at
execution time depending on timing.  It doesn't happen for me with
128kB (the setting used in the regression test), but I think the
affected BF machines are all 32 bit systems that have MAXIMUM_ALIGNOF
8 and therefore use a bit more space, whereas my machines have
MAXIMUM_ALIGNOF 4 in a 32 bit build, so that would explain the
different location of this unstable border.  We could probably fix the
failures by simply increasing work_mem out of that zone, but I'm
hoping to fix the problem in a more principled way.  More soon.

> BTW, I'm seeing a few things that look bug-like about
> ExecParallelHashTuplePrealloc, for instance why does it use just
> "size" to decide if space_allowed is exceeded but if not then add the
> typically-much-larger value "want + HASH_CHUNK_HEADER_SIZE" to
> estimated_size.  That clearly can allow estimated_size to get
> significantly past space_allowed --- if it's not a bug, it at least
> deserves a comment explaining why not.

Right.  Fixed in the attached.

> Another angle, which does not
> apply to this test case but seems like a bug for real usage, is that
> ExecParallelHashTuplePrealloc doesn't account correctly for tuples wider
> than HASH_CHUNK_THRESHOLD.

Right.  I'll address that separately.

> I'm also wondering why the non-parallel path seems to prefer to allocate
> in units of HASH_CHUNK_SIZE + HASH_CHUNK_HEADER_SIZE while the parallel
> path targets allocations of exactly HASH_CHUNK_SIZE,

That is intentional: dsa.c sucks at allocating 32KB + a tiny bit
because it works in 4KB pages for large allocations, so I wanted to
make HASH_CHUNK_SIZE the total size that arrives into dsa_allocate().
The non-parallel path has similar problems on some libc
implementations, as we discussed over here:

https://www.postgresql.org/message-id/flat/29770.1511495642%40sss.pgh.pa.us

> and why there's such
> inconsistency in whether tuples of exactly HASH_CHUNK_THRESHOLD bytes
> are treated as "big" or not.

Right, that's inconsistent.  Fixed in the attached.

--
Thomas Munro
http://www.enterprisedb.com
Вложения
Thomas Munro <thomas.munro@enterprisedb.com> writes:
> On Wed, Jan 3, 2018 at 2:38 PM, Tom Lane <tgl@sss.pgh.pa.us> wrote:
>> Hm.  That could do it, except it doesn't really account for the observed
>> result that slower single-processor machines seem more prone to the
>> bug.  Surely they should be less likely to get multiple workers activated.

> It plans for 8 batches, and then usually but not always goes to 16 at
> execution time depending on timing.  It doesn't happen for me with
> 128kB (the setting used in the regression test), but I think the
> affected BF machines are all 32 bit systems that have MAXIMUM_ALIGNOF
> 8 and therefore use a bit more space, whereas my machines have
> MAXIMUM_ALIGNOF 4 in a 32 bit build, so that would explain the
> different location of this unstable border.

Ah, that might do it.  You're right that gaur/pademelon are in that class.

> We could probably fix the
> failures by simply increasing work_mem out of that zone, but I'm
> hoping to fix the problem in a more principled way.  More soon.

Meh.  I think we're going to end up having to pick a modified test
case that's further away from the chunk size threshold.  I do not
think it is possible to predict this runtime behavior exactly at
plan time, nor am I convinced that expending planner cycles on a
somewhat closer estimate is a useful use of planning time.

>> I'm also wondering why the non-parallel path seems to prefer to allocate
>> in units of HASH_CHUNK_SIZE + HASH_CHUNK_HEADER_SIZE while the parallel
>> path targets allocations of exactly HASH_CHUNK_SIZE,

> That is intentional: dsa.c sucks at allocating 32KB + a tiny bit
> because it works in 4KB pages for large allocations, so I wanted to
> make HASH_CHUNK_SIZE the total size that arrives into dsa_allocate().
> The non-parallel path has similar problems on some libc
> implementations, as we discussed over here:
> https://www.postgresql.org/message-id/flat/29770.1511495642%40sss.pgh.pa.us

Oh, right, I'd forgotten about that discussion.  I think it would be
good to adjust hashjoin so that both paths are targeting 32KB total;
but you are right that there's not a lot of point in fooling with the
non-parallel path until we add some way of accounting for aset.c's
overhead too.  We can leave that for later.

>> BTW, I'm seeing a few things that look bug-like about
>> ExecParallelHashTuplePrealloc, ...

> Right.  Fixed in the attached.

Pushed, plus an additional Assert to clarify that we're expecting
ExecParallelHashTuplePrealloc's caller to have already maxalign'ed
the request size.

            regards, tom lane
So this patch has been in place for two weeks, the buildfarm has still
got the measles, and we're entering the January commitfest with a lot
of other work to get done.  I realize that the two weeks were mostly
holiday time, but it's time to have some urgency about clearing the
buildfarm failures.

As best I understand, the remaining failures simply arise from
an unstable regression test case and aren't teaching us anything
of value.  I propose that for the moment, we simply remove the
failing query from join.sql.  We can put it back when there's
reason to think it will pass everywhere.

            regards, tom lane
Hi,

On 2018-01-03 20:17:04 -0500, Tom Lane wrote:
> So this patch has been in place for two weeks, the buildfarm has still
> got the measles, and we're entering the January commitfest with a lot
> of other work to get done.  I realize that the two weeks were mostly
> holiday time, but it's time to have some urgency about clearing the
> buildfarm failures.

Agreed.


> As best I understand, the remaining failures simply arise from
> an unstable regression test case and aren't teaching us anything
> of value.

I think that's the correct interpretation.


> I propose that for the moment, we simply remove the
> failing query from join.sql.  We can put it back when there's
> reason to think it will pass everywhere.

Alternatively we could temporarily push an alternative output. It
doesn't seem inconceivable we missed an actual bug due to the
noise. Don't have a strong opinion on which of the two to choose.

Unless somebody does something first, I'll disable the test tomorrow
pacific morning. But perhaps Thomas can up with an approach till then
that seems likely to pass on the different architectures. Seems quite
possible to just adjust the thresholds carefully?


Greetings,

Andres Freund
On Thu, Jan 4, 2018 at 2:17 PM, Tom Lane <tgl@sss.pgh.pa.us> wrote:
> So this patch has been in place for two weeks, the buildfarm has still
> got the measles, and we're entering the January commitfest with a lot
> of other work to get done.  I realize that the two weeks were mostly
> holiday time, but it's time to have some urgency about clearing the
> buildfarm failures.
>
> As best I understand, the remaining failures simply arise from
> an unstable regression test case and aren't teaching us anything
> of value.  I propose that for the moment, we simply remove the
> failing query from join.sql.  We can put it back when there's
> reason to think it will pass everywhere.

I spent a lot of time trying and failing to get the world's slowest 32
bit powerpc emulation to reproduce this.  Bleugh.  Before we rip that
test out, would you mind checking if this passes repeatedly on gaur or
pademelon?

--
Thomas Munro
http://www.enterprisedb.com
Вложения
Thomas Munro <thomas.munro@enterprisedb.com> writes:
> I spent a lot of time trying and failing to get the world's slowest 32
> bit powerpc emulation to reproduce this.  Bleugh.  Before we rip that
> test out, would you mind checking if this passes repeatedly on gaur or
> pademelon?

Will do, but that machine is none too fast itself ... it'll be a few
hours before I can confirm anything.

            regards, tom lane
Thomas Munro <thomas.munro@enterprisedb.com> writes:
> I spent a lot of time trying and failing to get the world's slowest 32
> bit powerpc emulation to reproduce this.  Bleugh.  Before we rip that
> test out, would you mind checking if this passes repeatedly on gaur or
> pademelon?

I ran a couple dozen test cycles on gaur without a failure.  That's
not enough to really prove anything, but it's more successes than I was
getting before.  I pushed the patch so we can see what the rest of the
buildfarm thinks.

            regards, tom lane
I wrote:
> I ran a couple dozen test cycles on gaur without a failure.  That's
> not enough to really prove anything, but it's more successes than I was
> getting before.  I pushed the patch so we can see what the rest of the
> buildfarm thinks.

The early returns indicate that that problem is fixed; but now that the
noise level is down, it's possible to see that brolga is showing an actual
crash in the PHJ test, perhaps one time in four.  So we're not out of
the woods yet.  It seems to consistently look like this:

2017-12-21 17:34:52.092 EST [2252:4] LOG:  background worker "parallel worker" (PID 3584) was terminated by signal 11
2017-12-21 17:34:52.092 EST [2252:5] DETAIL:  Failed process was running: select count(*) from foo
      left join (select b1.id, b1.t from bar b1 join bar b2 using (id)) ss
      on foo.id < ss.id + 1 and foo.id > ss.id - 1;
2017-12-21 17:34:52.092 EST [2252:6] LOG:  terminating any other active server processes


Also, what the devil is happening on skink?

            regards, tom lane
On Fri, Jan 5, 2018 at 5:00 AM, Tom Lane <tgl@sss.pgh.pa.us> wrote:
> The early returns indicate that that problem is fixed;

Thanks for your help and patience with that.  I've made a list over
here so we don't lose track of the various things that should be
improved in this area, and will start a new thread when I have patches
to propose:  https://wiki.postgresql.org/wiki/Parallel_Hash

> but now that the
> noise level is down, it's possible to see that brolga is showing an actual
> crash in the PHJ test, perhaps one time in four.  So we're not out of
> the woods yet.  It seems to consistently look like this:
>
> 2017-12-21 17:34:52.092 EST [2252:4] LOG:  background worker "parallel worker" (PID 3584) was terminated by signal
11
> 2017-12-21 17:34:52.092 EST [2252:5] DETAIL:  Failed process was running: select count(*) from foo
>           left join (select b1.id, b1.t from bar b1 join bar b2 using (id)) ss
>           on foo.id < ss.id + 1 and foo.id > ss.id - 1;
> 2017-12-21 17:34:52.092 EST [2252:6] LOG:  terminating any other active server processes

That is a test of a parallel-aware hash join with a rescan (ie workers
get restarted repeatedly by the gather node reusing the DSM; maybe I
misunderstood some detail of the protocol for that).  I'll go and
review that code and try to reproduce the failure.  On the off-chance,
Andrew, is there any chance you have a core dump you could pull a
backtrace out of, on brolga?

--
Thomas Munro
http://www.enterprisedb.com
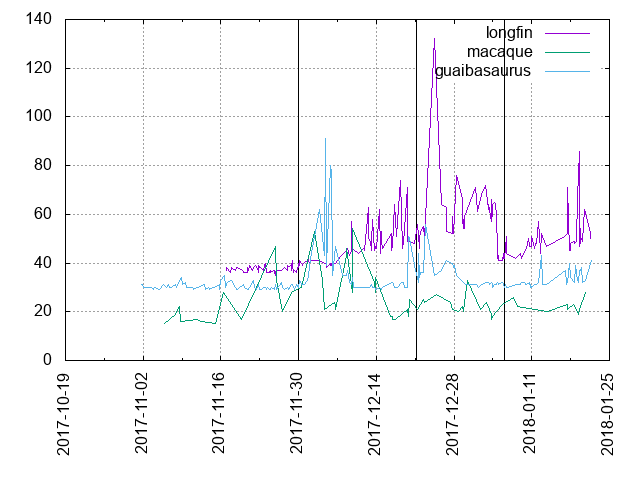
On Thu, Dec 28, 2017 at 5:26 PM, Tom Lane <tgl@sss.pgh.pa.us> wrote:
> Thomas Munro <thomas.munro@enterprisedb.com> writes:
>> On Thu, Dec 28, 2017 at 3:32 PM, Tom Lane <tgl@sss.pgh.pa.us> wrote:
>>> Aside from the instability problems, I'm pretty unhappy about how much
>>> the PHJ patch has added to the runtime of "make check".  I do not think
>>> any one feature can justify adding 20% to that.  Can't you cut down the
>>> amount of data processed by these new test cases?
>
>> Isn't that mostly because of the CV livelock problem?
>
> Hm, maybe.  I quoted the 20% figure on the basis of longfin's reports,
> not prairiedog's ... but it might be seeing some of the livelock effect
> too.
>
>> So without the effects of that bug it's only taking 2.4% longer than
>> commit fa330f9a.  Is that acceptable for a feature of this size and
>> complexity?  I will also look into making the data sets smaller.
>
> That sounds better, but it's still worth asking whether the tests
> could be quicker.

Here is a patch that halves the size of the test tables used.  I don't
want them to be too small because I want some some real parallel
processing at least sometimes.  On my slowest system with assertions
enabled this brings "time make check" from ~37.5s to ~36.9s.  I'm a
bit worried about choosing parameters that lead to instability across
the buildfarm, until I make the size estimation code a bit smarter[1],
so I tested a few variations that affect the alignment and size of
things (-m32, -malign-double, --disable-atomics, --disable-spinlocks)
and didn't see failures.  Does this pass repeatedly on gaur?

Since you mentioned longfin, I checked some historical "check"
runtimes and they seemed pretty erratic so I decided to bust out
gnuplot to try to see what's happening.  See attached, which goes back
as far as I could web-scrape from the buildfarm.  Three interesting
commits are shown with vertical lines, in this order from left to
right:

Commit fa330f9a "Add some regression tests that exercise hash join
code.", Nov 29.
Commit 18042840 "Add parallel-aware hash joins.", Dec 20
Commit aced5a92 "Rewrite ConditionVariableBroadcast() to avoid
live-lock.", Jan 5.

For comparison I also plotted data for two other machines whose times
are in a similar range.  It looks to me like longfin's average and
variation increased half way between fa330f9a and 18042840, somewhere
near Dec 7 to 9, when we went from ~40s +/- 1 to ~50s with several
seconds' variation.  Was there some other environmental change then on
that machine?  Do you see any commit that could explain that -- maybe
0a3edbb33?  Then maybe it also suffered a bit from livelock woes from
18042840 until aced5a92? It's hard to say and I'm not really sure what
to make of this, but it seems clear that you could draw the wrong
conclusion if you just picked a couple of random data points from that
animal, and that those other animals aren't affected too much by any
of these commits.

[1] https://wiki.postgresql.org/wiki/Parallel_Hash
Вложения
On Mon, Jan 22, 2018 at 11:17 PM, Thomas Munro
<thomas.munro@enterprisedb.com> wrote:
> It looks to me like longfin's average and
> variation increased half way between fa330f9a and 18042840, somewhere
> near Dec 7 to 9, when we went from ~40s +/- 1 to ~50s with several
> seconds' variation.  Was there some other environmental change then on
> that machine?

Ahh.  That corresponds to the release of this patch:

https://support.apple.com/en-nz/HT208331

And indeed I see from the logs that the kernel changed:

uname -v = Darwin Kernel Version 17.2.0: Fri Sep 29 18:27:05 PDT 2017;
root:xnu-4570.20.62~3/RELEASE_X86_64
uname -v = Darwin Kernel Version 17.3.0: Thu Nov  9 18:09:22 PST 2017;
root:xnu-4570.31.3~1/RELEASE_X86_64

--
Thomas Munro
http://www.enterprisedb.com
Thomas Munro <thomas.munro@enterprisedb.com> writes:
> On Mon, Jan 22, 2018 at 11:17 PM, Thomas Munro
> <thomas.munro@enterprisedb.com> wrote:
>> It looks to me like longfin's average and
>> variation increased half way between fa330f9a and 18042840, somewhere
>> near Dec 7 to 9, when we went from ~40s +/- 1 to ~50s with several
>> seconds' variation.  Was there some other environmental change then on
>> that machine?

> Ahh.  That corresponds to the release of this patch:
> https://support.apple.com/en-nz/HT208331

Yeah, I'm pretty sure that I installed that update immediately when
it came out.

There were some other strange things going on on that machine too;
I remember having noticed and killed a daemon process that seemed to be
stuck at 100% CPU.  That might explain the sudden dropoff in runtimes in
early January.  And seeing that the times seem to be back up, I looked
just now, and there it is again:

PID    COMMAND      %CPU TIME     #TH   #WQ  #PORT MEM    PURG   CMPRS  PGRP
360    fontworker   75.9 238 hrs  4     4    45-   28M    0B     0B     360
359    fontd        25.3 86:18:50 4/1   3/1  74    33M+   0B     1396K  359
76     logd         12.7 26:25:16 5     5    611   31M-   0B     0B     76
46241  top          2.6  00:01.04 1/1   0    23    2140K  0B     0B     46241

Weird --- my other macOS machines aren't doing that.

Anyway, it looks like we should write off these longfin timings as
ambient noise :-(

            regards, tom lane
I wrote:
> Anyway, it looks like we should write off these longfin timings as
> ambient noise :-(

Here's a possibly more useful graph of regression test timings over
the last year.  I pulled this from the buildfarm database: it is the
reported runtime for the "installcheck-C" step in each successful
build of HEAD on dromedary, going back to Jan. 2017.  I picked dromedary
because I know that that machine hasn't gotten any software updates
nor is there anything else very interesting going on on it.  I dropped
three or four obvious outlier reports (possibly those ran during the
machine's nightly backup cron job).  The reported runtime is only
precise to 1s, and a couple seconds jitter is hardly surprising, so
there's a good deal of noise.  Still, it's possible to discern when
I put some effort into test runtime reduction back in April, and
it can be seen that things have gotten notably slower since the
beginning of November.

            regards, tom lane
Вложения
Hi,

On 2018-01-22 23:17:47 +1300, Thomas Munro wrote:
> On Thu, Dec 28, 2017 at 5:26 PM, Tom Lane <tgl@sss.pgh.pa.us> wrote:
> Here is a patch that halves the size of the test tables used.  I don't
> want them to be too small because I want some some real parallel
> processing at least sometimes.  On my slowest system with assertions
> enabled this brings "time make check" from ~37.5s to ~36.9s.  I'm a
> bit worried about choosing parameters that lead to instability across
> the buildfarm, until I make the size estimation code a bit smarter[1],
> so I tested a few variations that affect the alignment and size of
> things (-m32, -malign-double, --disable-atomics, --disable-spinlocks)
> and didn't see failures.  Does this pass repeatedly on gaur?

I'd say, let's just commit it and see?

Will do so soon if nobody protests.

Greetings,

Andres Freund
Andres Freund <andres@anarazel.de> writes:
> On 2018-01-22 23:17:47 +1300, Thomas Munro wrote:
>> Here is a patch that halves the size of the test tables used.
>> ... Does this pass repeatedly on gaur?

> I'd say, let's just commit it and see?

Oh, sorry, I forgot I was on the hook to check that.  The news isn't
good: I got one pass, and then this on the second iteration:

*** /home/postgres/pgsql/src/test/regress/expected/join.out     Wed Jan 24 18:07:42 2018
--- /home/postgres/pgsql/src/test/regress/results/join.out      Wed Jan 24 18:26:53 2018
***************
*** 6122,6128 ****
  $$);
   initially_multibatch | increased_batches
  ----------------------+-------------------
!  t                    | f
  (1 row)

  rollback to settings;
--- 6122,6128 ----
  $$);
   initially_multibatch | increased_batches
  ----------------------+-------------------
!  t                    | t
  (1 row)

  rollback to settings;

======================================================================

            regards, tom lane