Обсуждение: The query plan get all columns but I'm using only one column.
We have production database that has slow queries because of the query get all columns even if I'm using only one column.
The result is slow for tables that there are too much columns
The weird part is that there is environment that I can't reproduce it even if they are using the same postgresql.conf
I didn't find what is the variant/configuration to avoid it
I could reproduce it using the official docker image of postgresql
* Steps to reproduce it
1. Run the following script:
docker run --name psql1 -d -e POSTGRES_PASSWORD=pwd postgres
docker exec -it --user=postgres psql1 psql
# Into docker container
CREATE DATABASE db;
\connect db;
CREATE TABLE link (
ID serial PRIMARY KEY,
url VARCHAR (255) NOT NULL,
name VARCHAR (255) NOT NULL,
description VARCHAR (255),
rel VARCHAR (50)
);
EXPLAIN (ANALYZE, VERBOSE, BUFFERS)
SELECT l1.url
FROM link l1
JOIN link l2
ON l1.url=l2.url;
2. See result of the Query Plan:
QUERY PLAN
-------------------------------------------------------------------------------------------
Hash Join (cost=10.90..21.85 rows=40 width=516) (actual time=0.080..0.081 rows=1 loops=1)
Output: l1.url
Hash Cond: ((l1.url)::text = (l2.url)::text)
Buffers: shared hit=5
-> Seq Scan on public.link l1 (cost=0.00..10.40 rows=40 width=516) (actual time=0.010..0.011 rows=1 loops=1)
Output: l1.id, l1.url, l1.name, l1.description, l1.rel
Buffers: shared hit=1
-> Hash (cost=10.40..10.40 rows=40 width=516) (actual time=0.021..0.021 rows=1 loops=1)
Output: l2.url
Buckets: 1024 Batches: 1 Memory Usage: 9kB
Buffers: shared hit=1
-> Seq Scan on public.link l2 (cost=0.00..10.40 rows=40 width=516) (actual time=0.010..0.011 rows=1 loops=1)
Output: l2.url
Buffers: shared hit=1
Planning Time: 0.564 ms
Execution Time: 0.142 ms
3. Notice that I'm using only the column "url" for "JOIN" and "SELECT" section,
but the "Output" section is returning all columns.
Is there a manner to avoid returning all columns in order to get a better performance?
Thank you in advance
* PostgreSQL version:
psql postgres -c "SELECT version()"
PostgreSQL 12.2 (Debian 12.2-2.pgdg100+1) on x86_64-pc-linux-gnu, compiled by gcc (Debian 8.3.0-6) 8.3.0, 64-bit
Changes made to the settings in the postgresql.conf file: see Server Configuration for a quick way to list them all.
without changes
Operating system and version:
cat /etc/os-release
PRETTY_NAME="Debian GNU/Linux 10 (buster)"
Moisés López
@moylop260
Moises Lopez <moylop260@vauxoo.com> writes:
>     ->  Seq Scan on public.link l1  (cost=0.00..10.40 rows=40 width=516)
> (actual time=0.010..0.011 rows=1 loops=1)
> *            Output: l1.id <http://l1.id>, l1.url, l1.name
> <http://l1.name>, l1.description, l1.rel*

This is normal; it is not a bug, and it is not a source of performance
issues either.  The planner is choosing to do that to avoid a projection
step in this plan node, because there's no need for one.  On the other
scan, where it *is* important to project out just the required columns to
minimize the size of the hash table above the scan, it does do so:

>             ->  Seq Scan on public.link l2  (cost=0.00..10.40 rows=40
> width=516) (actual time=0.010..0.011 rows=1 loops=1)
>                 Output: l2.url

> Is there a manner to avoid returning all columns in order to get a better
> performance?

You have not shown us anything about what your actual performance
issue is, but this isn't it.

https://wiki.postgresql.org/wiki/Slow_Query_Questions

            regards, tom lane
The example is nonsensical so I expect it is too contrived to be useful for analyzing the actual problem.
Additionally, the total query time is under 1ms and most of it is planning time. Use a prepared statement or do something else to reduce planning time like reducing statistics target if that actually makes sense for your use case.
Else, show us something much closer to the real problem.
Hello,
Thanks for reply
I have 2 environments production and staging.
The pg_settings result for both environment is the same:
| name | setting | min_val | max_val | context |
| effective_cache_size | 3,145,728 | 1 | 2,147,483,647 | user |
| shared_buffers | 1,048,576 | 16 | 1,073,741,823 | postmaster |
| work_mem | 5,592 | 64 | 2,147,483,647 | user |
I have created a backup from production and restored it in staging.
For staging I have configured the following extra parameters:
# config for testing environment only
fsync=off
full_page_write=off
checkpoint_timeout=45min
synchronous_commit=off
autovacuum=off
For staging the query plans was:
[{'QUERY PLAN': 'Aggregate (cost=7433.20..7433.21 rows=1 width=8) (actual time=56.372..56.372 rows=1 loops=1)'},
{'QUERY PLAN': ' Output: count(product_template.id)'},
{'QUERY PLAN': ' Buffers: shared hit=3580'},
{'QUERY PLAN': ' -> Hash Right Join (cost=3695.08..7349.06 rows=33656 width=4) (actual time=32.039..54.076 rows=33709 loops=1)'},
{'QUERY PLAN': ' Output: product_template.id'},
{'QUERY PLAN': ' Hash Cond: (ir_translation.res_id = product_template.id)'},
{'QUERY PLAN': ' Buffers: shared hit=3580'},
{'QUERY PLAN': ' -> Bitmap Heap Scan on public.ir_translation (cost=1128.80..4459.54 rows=24187 width=4) (actual time=6.143..18.122 rows=33293 loops=1)'},
{'QUERY PLAN': ' Output: ir_translation.id, ir_translation.lang, ir_translation.src, ir_translation.type, ir_translation.res_id, ir_translation.value, ir_translation.name, ir_translation.module, ir_translation.state, ir_translation.comments'},
{'QUERY PLAN': " Recheck Cond: (((ir_translation.name)::text = 'product.template,name'::text) AND ((ir_translation.lang)::text = 'es_CR'::text) AND ((ir_translation.type)::text = 'model'::text))"},
{'QUERY PLAN': " Filter: (ir_translation.value <> ''::text)"},
{'QUERY PLAN': ' Heap Blocks: exact=1632'},
{'QUERY PLAN': ' Buffers: shared hit=1872'},
{'QUERY PLAN': ' -> Bitmap Index Scan on ir_translation_ltn (cost=0.00..1122.76 rows=24187 width=0) (actual time=5.960..5.960 rows=33293 loops=1)'},
{'QUERY PLAN': " Index Cond: (((ir_translation.name)::text = 'product.template,name'::text) AND ((ir_translation.lang)::text = 'es_CR'::text) AND ((ir_translation.type)::text = 'model'::text))"},
{'QUERY PLAN': ' Buffers: shared hit=240'},
{'QUERY PLAN': ' -> Hash (cost=2145.57..2145.57 rows=33656 width=4) (actual time=25.724..25.724 rows=33709 loops=1)'},
{'QUERY PLAN': ' Output: product_template.id'},
{'QUERY PLAN': ' Buckets: 65536 Batches: 1 Memory Usage: 1698kB'},
{'QUERY PLAN': ' Buffers: shared hit=1708'},
{'QUERY PLAN': ' -> Seq Scan on public.product_template (cost=0.00..2145.57 rows=33656 width=4) (actual time=0.015..19.301 rows=33709 loops=1)'},
{'QUERY PLAN': ' Output: product_template.id'},
{'QUERY PLAN': " Filter: (product_template.active AND ((product_template.type)::text = ANY ('{consu,product}'::text[])))"},
{'QUERY PLAN': ' Rows Removed by Filter: 1297'},
{'QUERY PLAN': ' Buffers: shared hit=1708'},
{'QUERY PLAN': 'Planning time: 0.782 ms'},
{'QUERY PLAN': 'Execution time: 56.441 ms'}]
For production the query plan was:
[{'QUERY PLAN': 'Aggregate (cost=2157.08..2157.09 rows=1 width=8) (actual time=53219.763..53219.763 rows=1 loops=1)'},
{'QUERY PLAN': ' Output: count(product_template.id)'},
{'QUERY PLAN': ' Buffers: shared hit=27280'},
{'QUERY PLAN': ' -> Nested Loop Left Join (cost=0.42..2156.64 rows=175 width=4) (actual time=16.755..53215.383 rows=33709 loops=1)'},
{'QUERY PLAN': ' Output: product_template.id'},
{'QUERY PLAN': ' Inner Unique: true'},
{'QUERY PLAN': ' Join Filter: (product_template.id = ir_translation.res_id)'},
{'QUERY PLAN': ' Rows Removed by Join Filter: 576388512'},
{'QUERY PLAN': ' Buffers: shared hit=27280'},
{'QUERY PLAN': ' -> Seq Scan on public.product_template (cost=0.00..2145.57 rows=175 width=4) (actual time=0.016..30.750 rows=33709 loops=1)'},
{'QUERY PLAN': ' Output: product_template.id, product_template.create_uid, product_template.create_date, product_template.write_date, product_template.write_uid, product_template.supply_method, product_template.uos_id, product_template.list_price, product_template.weight, product_template.mes_type, product_template.uom_id, product_template.description_purchase, product_template.uos_coeff, product_template.purchase_ok, product_template.company_id, product_template.name, product_template.state, product_template.loc_rack, product_template.uom_po_id, product_template.type, product_template.description, product_template.loc_row, product_template.description_sale, product_template.procure_method, product_template.rental, product_template.sale_ok, product_template.sale_delay, product_template.loc_case, product_template.produce_delay, product_template.categ_id, product_template.volume, product_template.active, product_template.color, product_template.track_incoming, product_template.track_outgoing, product_template.track_all, product_template.track_production, product_template.sale_line_warn, product_template.sale_line_warn_msg, product_template.purchase_line_warn, product_template.purchase_line_warn_msg, product_template.sequence, product_template.invoice_policy, product_template.service_type, product_template.description_picking, product_template.tracking, product_template.recurring_invoice, product_template.purchase_method, product_template.purchase_requisition, product_template.default_code, product_template.expense_policy, product_template.location_id, product_template.warehouse_id, product_template.hs_code, product_template.responsible_id, product_template.description_pickingout, product_template.description_pickingin, product_template.subscription_template_id, product_template.service_tracking, product_template.message_main_attachment_id, product_template.service_to_purchase, product_template.l10n_cr_uom_id, product_template.l10n_cr_tariff_heading'},
{'QUERY PLAN': " Filter: (product_template.active AND ((product_template.type)::text = ANY ('{consu,product}'::text[])))"},
{'QUERY PLAN': ' Rows Removed by Filter: 1297'},
{'QUERY PLAN': ' Buffers: shared hit=1708'},
{'QUERY PLAN': ' -> Materialize (cost=0.42..8.45 rows=1 width=4) (actual time=0.000..0.650 rows=17100 loops=33709)'},
{'QUERY PLAN': ' Output: ir_translation.res_id'},
{'QUERY PLAN': ' Buffers: shared hit=25572'},
{'QUERY PLAN': ' -> Index Scan using ir_translation_unique on public.ir_translation (cost=0.42..8.44 rows=1 width=4) (actual time=0.039..21.429 rows=33293 loops=1)'},
{'QUERY PLAN': ' Output: ir_translation.res_id'},
{'QUERY PLAN': " Index Cond: (((ir_translation.type)::text = 'model'::text) AND ((ir_translation.name)::text = 'product.template,name'::text) AND ((ir_translation.lang)::text = 'es_CR'::text))"},
{'QUERY PLAN': " Filter: (ir_translation.value <> ''::text)"},
{'QUERY PLAN': ' Buffers: shared hit=25572'},
{'QUERY PLAN': 'Planning time: 0.615 ms'},
{'QUERY PLAN': 'Execution time: 53219.965 ms'}]
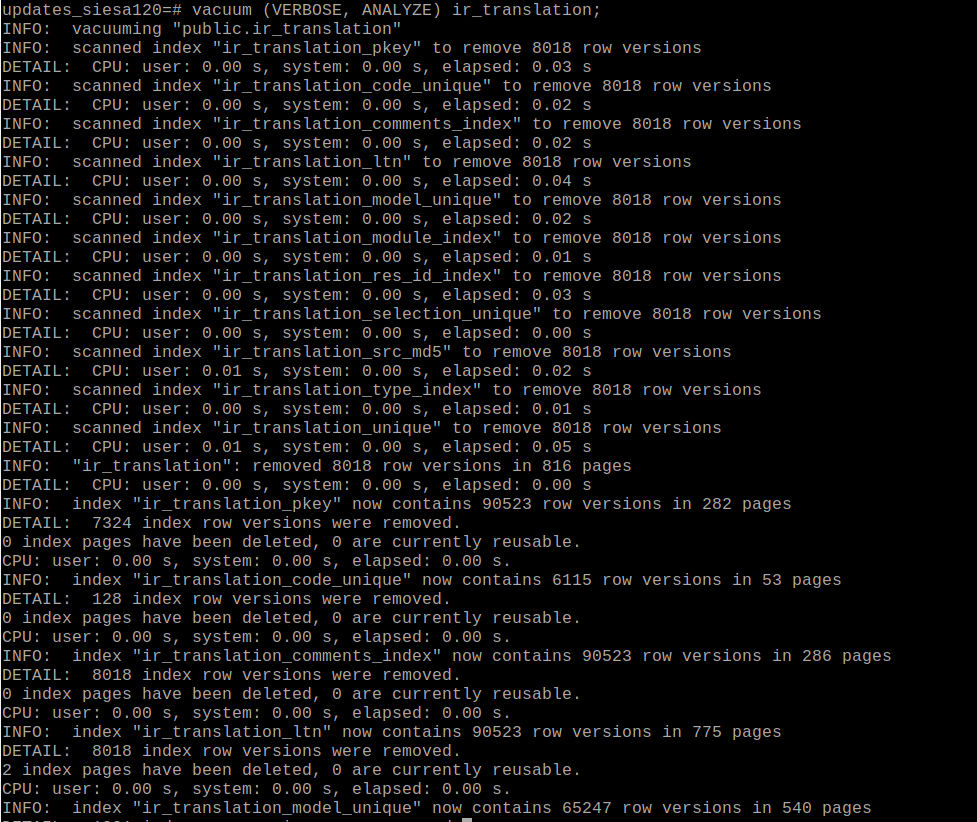
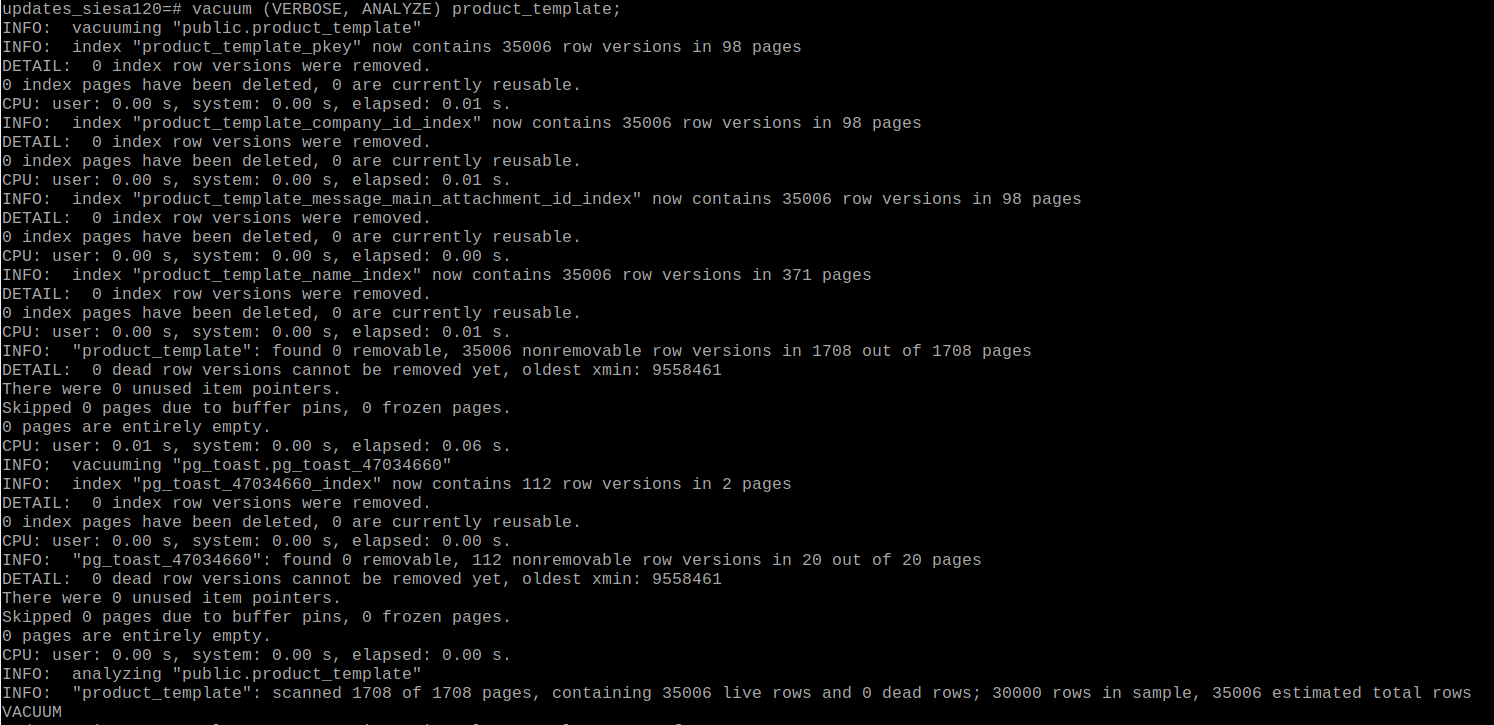
I have ran a manual "vacuum (VERBOSE, ANALYZE) product_template;" and "vacuum (VERBOSE, ANALYZE) ir_translation;" for production.
See the attachments production_vacuum_product_template.png and production_vacuum_ir_translation.png
After, the query plans result for production was:
{'QUERY PLAN': 'Aggregate (cost=7063.88..7063.89 rows=1 width=8) (actual time=36.513..36.514 rows=1 loops=1)'},
{'QUERY PLAN': ' Output: count(product_template.id)'},
{'QUERY PLAN': ' Buffers: shared hit=3580'},
{'QUERY PLAN': ' -> Hash Left Join (cost=4745.62..6979.65 rows=33693 width=4) (actual time=18.165..34.420 rows=33709 loops=1)'},
{'QUERY PLAN': ' Output: product_template.id'},
{'QUERY PLAN': ' Inner Unique: true'},
{'QUERY PLAN': ' Hash Cond: (product_template.id = ir_translation.res_id)'},
{'QUERY PLAN': ' Buffers: shared hit=3580'},
{'QUERY PLAN': ' -> Seq Scan on public.product_template (cost=0.00..2145.57 rows=33693 width=4) (actual time=0.006..10.797 rows=33709 loops=1)'},
{'QUERY PLAN': ' Output: product_template.id, product_template.create_uid, product_template.create_date, product_template.write_date, product_template.write_uid, product_template.supply_method, product_template.uos_id, product_template.list_price, product_template.weight, product_template.mes_type, product_template.uom_id, product_template.description_purchase, product_template.uos_coeff, product_template.purchase_ok, product_template.company_id, product_template.name, product_template.state, product_template.loc_rack, product_template.uom_po_id, product_template.type, product_template.description, product_template.loc_row, product_template.description_sale, product_template.procure_method, product_template.rental, product_template.sale_ok, product_template.sale_delay, product_template.loc_case, product_template.produce_delay, product_template.categ_id, product_template.volume, product_template.active, product_template.color, product_template.track_incoming, product_template.track_outgoing, product_template.track_all, product_template.track_production, product_template.sale_line_warn, product_template.sale_line_warn_msg, product_template.purchase_line_warn, product_template.purchase_line_warn_msg, product_template.sequence, product_template.invoice_policy, product_template.service_type, product_template.description_picking, product_template.tracking, product_template.recurring_invoice, product_template.purchase_method, product_template.purchase_requisition, product_template.default_code, product_template.expense_policy, product_template.location_id, product_template.warehouse_id, product_template.hs_code, product_template.responsible_id, product_template.description_pickingout, product_template.description_pickingin, product_template.subscription_template_id, product_template.service_tracking, product_template.message_main_attachment_id, product_template.service_to_purchase, product_template.l10n_cr_uom_id, product_template.l10n_cr_tariff_heading'},
{'QUERY PLAN': " Filter: (product_template.active AND ((product_template.type)::text = ANY ('{consu,product}'::text[])))"},
{'QUERY PLAN': ' Rows Removed by Filter: 1297'},
{'QUERY PLAN': ' Buffers: shared hit=1708'},
{'QUERY PLAN': ' -> Hash (cost=4447.50..4447.50 rows=23849 width=4) (actual time=18.138..18.138 rows=33293 loops=1)'},
{'QUERY PLAN': ' Output: ir_translation.res_id'},
{'QUERY PLAN': ' Buckets: 65536 (originally 32768) Batches: 1 (originally 1) Memory Usage: 1683kB'},
{'QUERY PLAN': ' Buffers: shared hit=1872'},
{'QUERY PLAN': ' -> Bitmap Heap Scan on public.ir_translation (cost=1124.50..4447.50 rows=23849 width=4) (actual time=5.120..13.517 rows=33293 loops=1)'},
{'QUERY PLAN': ' Output: ir_translation.res_id'},
{'QUERY PLAN': " Recheck Cond: (((ir_translation.name)::text = 'product.template,name'::text) AND ((ir_translation.lang)::text = 'es_CR'::text) AND ((ir_translation.type)::text = 'model'::text))"},
{'QUERY PLAN': " Filter: (ir_translation.value <> ''::text)"},
{'QUERY PLAN': ' Heap Blocks: exact=1632'},
{'QUERY PLAN': ' Buffers: shared hit=1872'},
{'QUERY PLAN': ' -> Bitmap Index Scan on ir_translation_ltn (cost=0.00..1118.54 rows=23850 width=0) (actual time=4.908..4.908 rows=33293 loops=1)'},
{'QUERY PLAN': " Index Cond: (((ir_translation.name)::text = 'product.template,name'::text) AND ((ir_translation.lang)::text = 'es_CR'::text) AND ((ir_translation.type)::text = 'model'::text))"},
{'QUERY PLAN': ' Buffers: shared hit=240'},
{'QUERY PLAN': 'Planning time: 0.363 ms'},
{'QUERY PLAN': 'Execution time: 36.666 ms'},
]
So, the my problem was fixed with VACUUM in production.
Thank you!
El sáb., 25 abr. 2020 a las 15:40, Michael Lewis (<mlewis@entrata.com>) escribió:
The example is nonsensical so I expect it is too contrived to be useful for analyzing the actual problem.Additionally, the total query time is under 1ms and most of it is planning time. Use a prepared statement or do something else to reduce planning time like reducing statistics target if that actually makes sense for your use case.Else, show us something much closer to the real problem.
Moisés López Calderón
Mobile: (+521) 477-752-22-30
Twitter: @moylop260
Twitter: @vauxoo
Вложения
It is generally a very bad idea to turn off autovacuum. When it is causing problems, it is likely that it needs to run more often to keep up with the work, rather than not run at all. Certainly if it is turned off, it would be critical to have a regularly scheduled process to vacuum analyze all tables.
In staging environment we have disabled autovacuum since that it is a testing environment and the database are restored very often.But in production environment it is enabled autovacuum=onThe weird case is that production was slow and staging environment was faster.
You haven't specified how you are doing backup and restore, but unless it is a byte-for-byte file copy method, then there would be no bloat on the restored staging environment so no need to vacuum. You would want to ensure you take a new statistics sample with analyze database after restore if you aren't.
In your production system, if your configs for autovacuum settings have not been changed from the default parameters, it probably is not keeping up at all if the system is moderately high in terms of update/delete transactions. You can check pg_stat_activity for active vacuums, change the parameter to log autovacuums longer than X to 0 and review the logs, or check pg_stat_user_tables to see how many autovacuums/analyze have been done since you last reset those stats.
If you have tables that are in the millions or hundreds or millions of rows, then I would recommend decreasing autovacuum_vacuum_scale_factor from 20% down to 1% or perhaps less and similar for autovacuum_analyze_scale_factor. You can do this on individual tables if you have mostly small tables and just a few large ones. Else, increase the threshold settings as well. The default value for autovacuum_vacuum_cost_delay changed from 20ms to 2ms in PG12 so that may also be prudent to do likewise if you upgraded to PG12 and kept your old settings, assuming your I/O system can handle it.
Otherwise, if you have a period of time when the activity is low for your database(s), then a last resort can be a daily scheduled vacuum analyze on all tables. Note- do not do vacuum FULL which requires an exclusive lock on the table to re-write it entirely. You are just looking to mark space re-usable for future transactions, not recover the disk space back to the OS to be consumed again if autovacuum still can't keep up. pg_repack extension would be an option if you need to recover disk space while online.
Michael,
Your complete explanation is very helpful!
I appreciate it
Thank you so much!
Regards!
El jue., 30 abr. 2020 a las 10:52, Michael Lewis (<mlewis@entrata.com>) escribió:
In staging environment we have disabled autovacuum since that it is a testing environment and the database are restored very often.But in production environment it is enabled autovacuum=onThe weird case is that production was slow and staging environment was faster.You haven't specified how you are doing backup and restore, but unless it is a byte-for-byte file copy method, then there would be no bloat on the restored staging environment so no need to vacuum. You would want to ensure you take a new statistics sample with analyze database after restore if you aren't.In your production system, if your configs for autovacuum settings have not been changed from the default parameters, it probably is not keeping up at all if the system is moderately high in terms of update/delete transactions. You can check pg_stat_activity for active vacuums, change the parameter to log autovacuums longer than X to 0 and review the logs, or check pg_stat_user_tables to see how many autovacuums/analyze have been done since you last reset those stats.If you have tables that are in the millions or hundreds or millions of rows, then I would recommend decreasing autovacuum_vacuum_scale_factor from 20% down to 1% or perhaps less and similar for autovacuum_analyze_scale_factor. You can do this on individual tables if you have mostly small tables and just a few large ones. Else, increase the threshold settings as well. The default value for autovacuum_vacuum_cost_delay changed from 20ms to 2ms in PG12 so that may also be prudent to do likewise if you upgraded to PG12 and kept your old settings, assuming your I/O system can handle it.Otherwise, if you have a period of time when the activity is low for your database(s), then a last resort can be a daily scheduled vacuum analyze on all tables. Note- do not do vacuum FULL which requires an exclusive lock on the table to re-write it entirely. You are just looking to mark space re-usable for future transactions, not recover the disk space back to the OS to be consumed again if autovacuum still can't keep up. pg_repack extension would be an option if you need to recover disk space while online.
Moisés López Calderón
Mobile: (+521) 477-752-22-30
Twitter: @moylop260
Twitter: @vauxoo